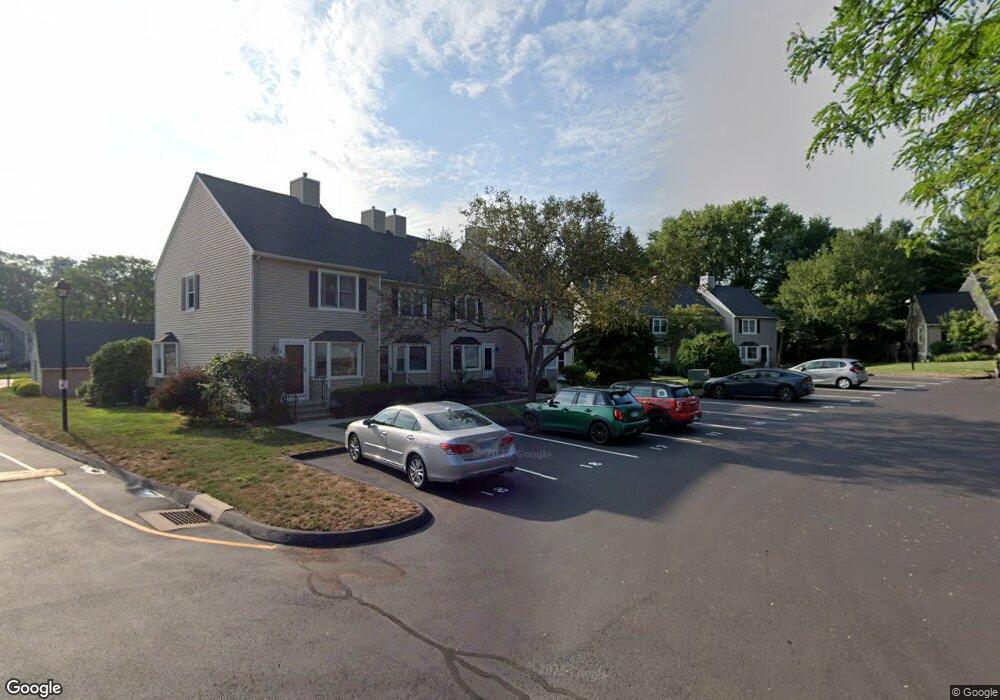
15 Braintree Ct Suffield, CT 06078
Estimated Value: $287,654 - $329,000
2
Beds
2
Baths
1,234
Sq Ft
$253/Sq Ft
Est. Value
About This Home
This home is located at 15 Braintree Ct, Suffield, CT 06078 and is currently estimated at $311,914, approximately $252 per square foot. 15 Braintree Ct is a home located in Hartford County with nearby schools including A. Ward Spaulding School, Mcalister Intermediate School, and Suffield Middle School.
Ownership History
Date
Name
Owned For
Owner Type
Purchase Details
Closed on
Apr 24, 2020
Sold by
Taylor Ashley
Bought by
Voss Lord
Current Estimated Value
Home Financials for this Owner
Home Financials are based on the most recent Mortgage that was taken out on this home.
Original Mortgage
$164,803
Outstanding Balance
$144,429
Interest Rate
3.3%
Mortgage Type
New Conventional
Estimated Equity
$167,485
Purchase Details
Closed on
May 8, 2013
Sold by
Typeowicz Francis J and Typeowicz Virginia
Bought by
Taylor Ashley
Home Financials for this Owner
Home Financials are based on the most recent Mortgage that was taken out on this home.
Original Mortgage
$156,122
Interest Rate
3.6%
Mortgage Type
New Conventional
Purchase Details
Closed on
Nov 22, 1999
Sold by
Klesczewski Robert and Klesczewski Maura
Bought by
Typrowicz Francis and Typrowicz Virginia
Purchase Details
Closed on
Aug 28, 1998
Sold by
Zmituk Karen
Bought by
Klesczewski Robert and Klesczewski Maura
Create a Home Valuation Report for This Property
The Home Valuation Report is an in-depth analysis detailing your home's value as well as a comparison with similar homes in the area
Home Values in the Area
Average Home Value in this Area
Purchase History
| Date | Buyer | Sale Price | Title Company |
|---|---|---|---|
| Voss Lord | $169,900 | None Available | |
| Taylor Ashley | $179,900 | -- | |
| Typrowicz Francis | $95,000 | -- | |
| Klesczewski Robert | $83,700 | -- |
Source: Public Records
Mortgage History
| Date | Status | Borrower | Loan Amount |
|---|---|---|---|
| Open | Voss Lord | $164,803 | |
| Previous Owner | Klesczewski Robert | $156,122 | |
| Previous Owner | Klesczewski Robert | $83,000 | |
| Previous Owner | Klesczewski Robert | $89,000 |
Source: Public Records
Tax History
| Year | Tax Paid | Tax Assessment Tax Assessment Total Assessment is a certain percentage of the fair market value that is determined by local assessors to be the total taxable value of land and additions on the property. | Land | Improvement |
|---|---|---|---|---|
| 2025 | $3,582 | $153,020 | $0 | $153,020 |
| 2024 | $3,463 | $153,020 | $0 | $153,020 |
| 2023 | $3,000 | $104,860 | $0 | $104,860 |
| 2022 | $3,000 | $104,860 | $0 | $104,860 |
| 2021 | $3,003 | $104,860 | $0 | $104,860 |
| 2020 | $3,003 | $104,860 | $0 | $104,860 |
| 2019 | $3,012 | $104,860 | $0 | $104,860 |
| 2018 | $3,183 | $108,570 | $0 | $108,570 |
| 2017 | $3,137 | $108,570 | $0 | $108,570 |
| 2016 | $3,062 | $108,570 | $0 | $108,570 |
| 2015 | $3,016 | $108,570 | $0 | $108,570 |
| 2014 | $2,944 | $108,570 | $0 | $108,570 |
Source: Public Records
Map
Nearby Homes
- 83 Landing Cir Unit 83
- 24 Pebblestone Cir Unit 24
- 4 Pebblestone Cir
- 80 S River St
- 69 Prospect St
- 98 1st St
- 45 Douglas St
- 120 2nd St
- 57 Asnuntuck St
- 20 Walnut St
- 3 Riverdale Rd
- 1165 Enfield St Unit 11
- 30 Church St
- 26 Church St
- 3 Martin St
- 713 Thrall Ave
- 60 Lincoln St
- 779 Bridge St
- 39 Union Street Extension
- 42 Hartford Ave
- 12 Braintree Ct
- 12 Braintree Ct Unit 12
- 13 Braintree Ct
- 14 Braintree Ct
- 14 Braintree Ct Unit 14
- 10 Braintree Ct
- 15 Braintree Ct Unit 15
- 9 Braintree Ct
- 9 Braintree Ct Unit 9
- 8 Braintree Ct
- 17 Braintree Ct
- 7 Braintree Ct
- 7 Braintree Ct Unit 2A
- 7 Braintree Ct Unit 7
- 6 Braintree Ct
- 6 Braintree Ct Unit 6
- 5 Braintree Ct
- 4 Braintree Ct
- 4 Braintree Ct Unit 4
- 3 Braintree Ct
Your Personal Tour Guide
Ask me questions while you tour the home.