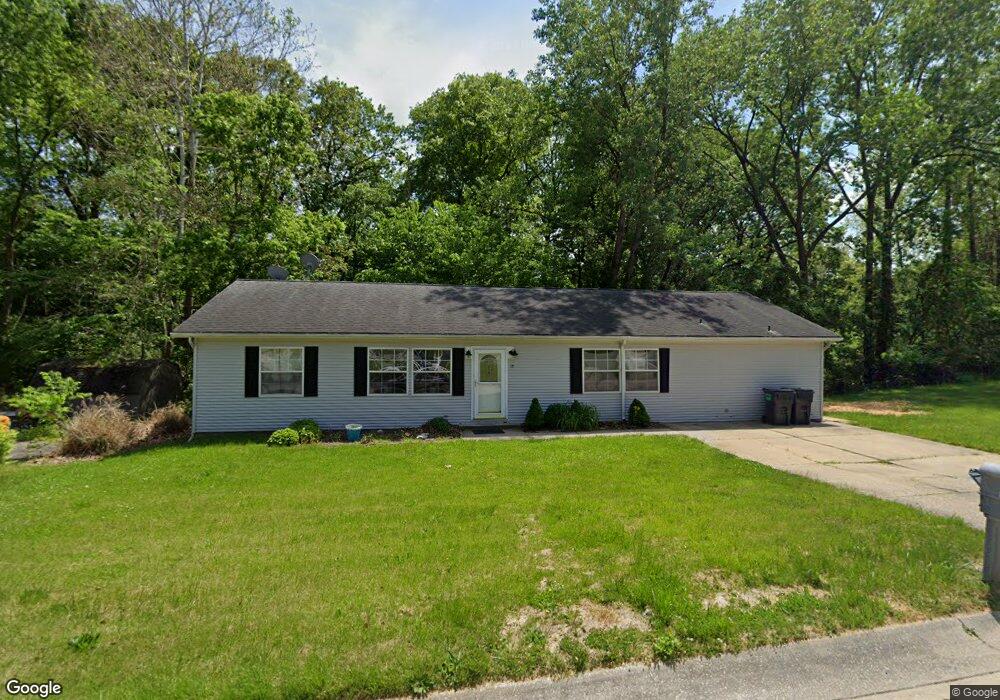
15 Brown Dr Fairview Heights, IL 62208
Estimated Value: $130,000 - $183,000
3
Beds
2
Baths
1,960
Sq Ft
$82/Sq Ft
Est. Value
About This Home
This home is located at 15 Brown Dr, Fairview Heights, IL 62208 and is currently estimated at $161,571, approximately $82 per square foot. 15 Brown Dr is a home located in St. Clair County with nearby schools including Illini Elementary School, Grant Middle School, and Blessed Sacrament Catholic School.
Ownership History
Date
Name
Owned For
Owner Type
Purchase Details
Closed on
Feb 3, 2023
Sold by
Td Properties Il Llc
Bought by
Three Doors Properties Llc
Current Estimated Value
Purchase Details
Closed on
Sep 20, 2022
Sold by
Sanders Karryn
Bought by
Td Properties Il Llc
Home Financials for this Owner
Home Financials are based on the most recent Mortgage that was taken out on this home.
Original Mortgage
$99,520
Interest Rate
5.22%
Mortgage Type
Commercial
Purchase Details
Closed on
May 12, 2008
Sold by
Lacey Monica S
Bought by
Sanders Karryn
Home Financials for this Owner
Home Financials are based on the most recent Mortgage that was taken out on this home.
Original Mortgage
$120,400
Interest Rate
5.93%
Mortgage Type
VA
Purchase Details
Closed on
Feb 26, 2003
Sold by
Ralph William J and Ralph Maribeth
Bought by
Lacey Monica S
Home Financials for this Owner
Home Financials are based on the most recent Mortgage that was taken out on this home.
Original Mortgage
$123,731
Interest Rate
5.95%
Mortgage Type
FHA
Create a Home Valuation Report for This Property
The Home Valuation Report is an in-depth analysis detailing your home's value as well as a comparison with similar homes in the area
Home Values in the Area
Average Home Value in this Area
Purchase History
| Date | Buyer | Sale Price | Title Company |
|---|---|---|---|
| Three Doors Properties Llc | -- | None Available | |
| Td Properties Il Llc | $75,000 | None Available | |
| Sanders Karryn | $118,000 | Freedom Title | |
| Lacey Monica S | $10,000 | Benchmark Title Company |
Source: Public Records
Mortgage History
| Date | Status | Borrower | Loan Amount |
|---|---|---|---|
| Previous Owner | Td Properties Il Llc | $99,520 | |
| Previous Owner | Sanders Karryn | $120,400 | |
| Previous Owner | Lacey Monica S | $123,731 |
Source: Public Records
Tax History Compared to Growth
Tax History
| Year | Tax Paid | Tax Assessment Tax Assessment Total Assessment is a certain percentage of the fair market value that is determined by local assessors to be the total taxable value of land and additions on the property. | Land | Improvement |
|---|---|---|---|---|
| 2024 | $3,107 | $39,369 | $4,967 | $34,402 |
| 2023 | $2,954 | $34,834 | $4,395 | $30,439 |
| 2022 | $2,957 | $34,141 | $4,308 | $29,833 |
| 2021 | $2,823 | $32,404 | $4,089 | $28,315 |
| 2020 | $2,777 | $30,695 | $3,874 | $26,821 |
| 2019 | $2,683 | $30,695 | $3,874 | $26,821 |
| 2018 | $2,747 | $31,434 | $4,142 | $27,292 |
| 2017 | $2,688 | $30,158 | $3,974 | $26,184 |
| 2016 | $2,707 | $29,477 | $3,884 | $25,593 |
| 2014 | $2,962 | $36,586 | $4,413 | $32,173 |
| 2013 | $3,123 | $37,260 | $4,494 | $32,766 |
Source: Public Records
Map
Nearby Homes
- 10 Hill Dr Unit . A, B, C
- 10 Hill Dr Unit D, E, F
- 9723 Greenridge Heights Rd
- 9915 North Rd
- 504 Saint Clair Rd
- 9629 Holdener Place
- 10010 S Road Ln
- 25 Clark Dr
- 1 AC Highridge Dr
- 0 Holdener Dr
- 9700 Mark Trail
- 9515 Holy Cross Rd
- 4 Primrose Ln
- 225 Merriweather Ln
- 216 Laurel Dr
- 23 Enterprise Rd
- 212 Woodcrest Dr
- 212 Mcknight Rd
- 318 Union Hill Rd
- 214 Union Hill Rd