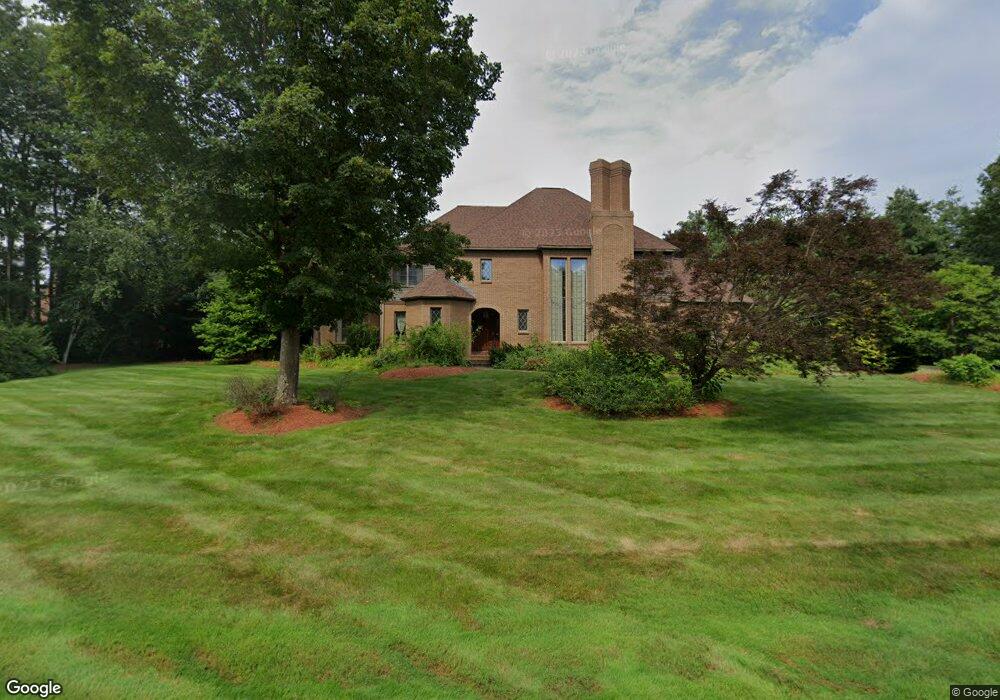
15 Camelot Rd Windham, NH 03087
Estimated Value: $1,606,887 - $2,084,000
4
Beds
7
Baths
6,274
Sq Ft
$300/Sq Ft
Est. Value
About This Home
This home is located at 15 Camelot Rd, Windham, NH 03087 and is currently estimated at $1,881,222, approximately $299 per square foot. 15 Camelot Rd is a home located in Rockingham County with nearby schools including Golden Brook Elementary School, Windham Middle School, and Windham High School.
Ownership History
Date
Name
Owned For
Owner Type
Purchase Details
Closed on
Mar 28, 2003
Sold by
Zeras Peter
Bought by
Guo Jerry Zhiyi
Current Estimated Value
Purchase Details
Closed on
Nov 18, 1998
Sold by
Macoul John A and Macoul Clare A
Bought by
Zeras Peter and Zeras Debra L
Home Financials for this Owner
Home Financials are based on the most recent Mortgage that was taken out on this home.
Original Mortgage
$450,000
Interest Rate
6.49%
Create a Home Valuation Report for This Property
The Home Valuation Report is an in-depth analysis detailing your home's value as well as a comparison with similar homes in the area
Home Values in the Area
Average Home Value in this Area
Purchase History
| Date | Buyer | Sale Price | Title Company |
|---|---|---|---|
| Guo Jerry Zhiyi | $945,000 | -- | |
| Zeras Peter | $572,500 | -- |
Source: Public Records
Mortgage History
| Date | Status | Borrower | Loan Amount |
|---|---|---|---|
| Previous Owner | Zeras Peter | $450,000 |
Source: Public Records
Tax History Compared to Growth
Tax History
| Year | Tax Paid | Tax Assessment Tax Assessment Total Assessment is a certain percentage of the fair market value that is determined by local assessors to be the total taxable value of land and additions on the property. | Land | Improvement |
|---|---|---|---|---|
| 2024 | $21,676 | $957,400 | $211,200 | $746,200 |
| 2023 | $20,488 | $957,400 | $211,200 | $746,200 |
| 2022 | $18,918 | $957,400 | $211,200 | $746,200 |
| 2021 | $17,827 | $957,400 | $211,200 | $746,200 |
| 2020 | $18,315 | $957,400 | $211,200 | $746,200 |
| 2019 | $16,894 | $749,200 | $193,100 | $556,100 |
| 2018 | $17,449 | $749,200 | $193,100 | $556,100 |
| 2017 | $15,134 | $749,200 | $193,100 | $556,100 |
| 2016 | $16,348 | $749,200 | $193,100 | $556,100 |
| 2015 | $16,273 | $749,200 | $193,100 | $556,100 |
| 2014 | $20,616 | $859,000 | $211,000 | $648,000 |
| 2013 | $20,596 | $872,700 | $211,000 | $661,700 |
Source: Public Records
Map
Nearby Homes
- 7 Camelot Rd
- 49 Hickory Ln
- 64 Stacey Cir
- 9 Cardinal Rd
- 7 Cardinal Rd
- 6 Londonderry Rd
- 15 Enterprise Dr
- 54 Enterprise Dr
- 10 1st St
- 70 Governor Dinsmore Rd
- 39 Overton Rd
- 18 Hawthorne Rd
- 6 Chadwick Cir
- Lot 5 Plan at Highclere
- 63 Searles Rd
- 11 Park St
- 1 Squire Armour Rd
- 21 Lakeshore Rd
- 26 Partridge Rd
- 14 Woodland Rd