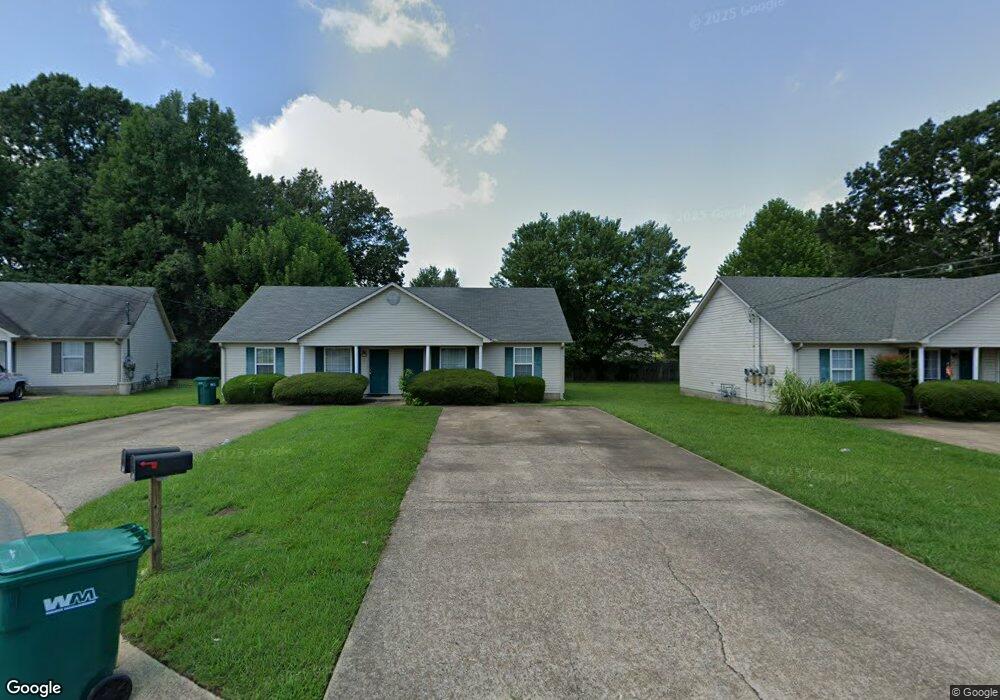
15 Carlton Place Unit 17 Jackson, TN 38305
Estimated Value: $146,101 - $213,000
--
Bed
2
Baths
1,600
Sq Ft
$113/Sq Ft
Est. Value
About This Home
This home is located at 15 Carlton Place Unit 17, Jackson, TN 38305 and is currently estimated at $181,034, approximately $113 per square foot. 15 Carlton Place Unit 17 is a home located in Madison County with nearby schools including Thelma Barker Elementary School, Northeast Middle School, and North Side High School.
Ownership History
Date
Name
Owned For
Owner Type
Purchase Details
Closed on
Jan 9, 2025
Sold by
Mgm Properties
Bought by
Farmer Andy
Current Estimated Value
Purchase Details
Closed on
Nov 18, 2016
Sold by
Krisher Reed
Bought by
Mgm Properties
Purchase Details
Closed on
Jul 9, 2009
Sold by
White Mike
Bought by
Krisher Reed
Purchase Details
Closed on
Mar 1, 2002
Sold by
Mike White
Bought by
White Melissa D
Purchase Details
Closed on
Aug 7, 1997
Sold by
Taylor Pendergrass Lee
Bought by
Mike White
Purchase Details
Closed on
Jun 12, 1995
Sold by
Taylor Pendergrass Lee
Bought by
Gary Miller Const
Purchase Details
Closed on
Oct 25, 1994
Bought by
Pendergrass Lee Taylor
Purchase Details
Closed on
Feb 4, 1985
Bought by
Brentwood Properties
Create a Home Valuation Report for This Property
The Home Valuation Report is an in-depth analysis detailing your home's value as well as a comparison with similar homes in the area
Home Values in the Area
Average Home Value in this Area
Purchase History
| Date | Buyer | Sale Price | Title Company |
|---|---|---|---|
| Farmer Andy | $1,450,000 | None Listed On Document | |
| Farmer Andy | $1,450,000 | None Listed On Document | |
| Mgm Properties | $89,500 | -- | |
| Krisher Reed | $98,000 | -- | |
| White Melissa D | -- | -- | |
| Mike White | $82,500 | -- | |
| Gary Miller Const | $8,500 | -- | |
| Pendergrass Lee Taylor | $12,000 | -- | |
| Brentwood Properties | -- | -- |
Source: Public Records
Tax History Compared to Growth
Tax History
| Year | Tax Paid | Tax Assessment Tax Assessment Total Assessment is a certain percentage of the fair market value that is determined by local assessors to be the total taxable value of land and additions on the property. | Land | Improvement |
|---|---|---|---|---|
| 2024 | $764 | $40,760 | $5,400 | $35,360 |
| 2022 | $1,421 | $40,760 | $5,400 | $35,360 |
| 2021 | $1,454 | $33,720 | $5,400 | $28,320 |
| 2020 | $1,454 | $33,720 | $5,400 | $28,320 |
| 2019 | $1,454 | $33,720 | $5,400 | $28,320 |
| 2018 | $1,454 | $33,720 | $5,400 | $28,320 |
| 2017 | $1,451 | $32,880 | $5,400 | $27,480 |
| 2016 | $1,352 | $32,880 | $5,400 | $27,480 |
| 2015 | $1,352 | $32,880 | $5,400 | $27,480 |
| 2014 | $1,352 | $32,880 | $5,400 | $27,480 |
Source: Public Records
Map
Nearby Homes
- 25 Haden Cove
- 50 Bent Tree Cove
- 23 Tuscany Cove
- 18 Serenade Cove
- 11 Tuscany Cove
- 453 Fairway Blvd
- 447 Fairway Blvd
- 441 Fairway Blvd
- 435 Fairway Blvd
- 429 Fairway Blvd
- 403 Fairway Blvd
- 404 Fairway Blvd
- 398 Fairway Blvd
- 422 Fairway Blvd
- 428 Fairway Blvd
- 440 Fairway Blvd
- 24 Cedar Crest Cove
- 18 Cedar Crest Cove
- 42 Mallory Dr
- 50 Garrison Dr
- 23 Carlton Place Unit 25
- 9 Carlton Place Unit 11
- 10 Countryside Dr
- 14 Countryside Dr
- 33 Carlton Place Unit 35
- 6 Countryside Dr
- 18 Countryside Dr
- 16 Carlton Place Unit 18
- 18 Carlton Place
- 8 Carlton Place Unit 10
- 30 Carlton Place Unit 32
- 24 Countryside Dr
- 22 Carlton Place Unit 24
- 15 Harvest Dr
- 28 Countryside Dr
- 19 Harvest Dr
- 736 Old Humboldt Rd
- 23 Harvest Dr
- 745 Old Humboldt Rd
- 740 Old Humboldt Rd