Estimated Value: $1,279,000 - $1,496,288
3
Beds
2
Baths
1,620
Sq Ft
$830/Sq Ft
Est. Value
About This Home
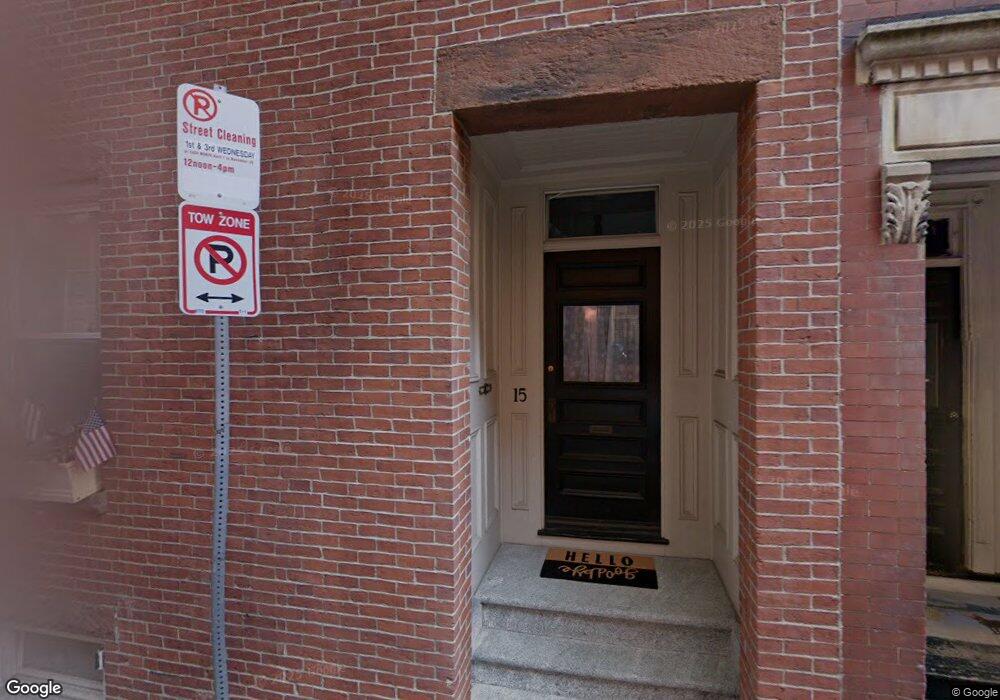
This home is located at 15 Cedar St, Charlestown, MA 02129 and is currently estimated at $1,344,072, approximately $829 per square foot. 15 Cedar St is a home located in Suffolk County with nearby schools including Boston Children's School and St John School.
Ownership History
Date
Name
Owned For
Owner Type
Purchase Details
Closed on
Feb 18, 2023
Sold by
2 L Prop A Series Llc
Bought by
Tuel Matthew J and Tuel Deborah A
Current Estimated Value
Create a Home Valuation Report for This Property
The Home Valuation Report is an in-depth analysis detailing your home's value as well as a comparison with similar homes in the area
Home Values in the Area
Average Home Value in this Area
Purchase History
| Date | Buyer | Sale Price | Title Company |
|---|---|---|---|
| Tuel Matthew J | -- | None Available |
Source: Public Records
Tax History Compared to Growth
Tax History
| Year | Tax Paid | Tax Assessment Tax Assessment Total Assessment is a certain percentage of the fair market value that is determined by local assessors to be the total taxable value of land and additions on the property. | Land | Improvement |
|---|---|---|---|---|
| 2025 | $13,219 | $1,141,500 | $420,800 | $720,700 |
| 2024 | $11,591 | $1,063,400 | $378,100 | $685,300 |
| 2023 | $11,421 | $1,063,400 | $378,100 | $685,300 |
| 2022 | $11,233 | $1,032,400 | $367,100 | $665,300 |
| 2021 | $11,016 | $1,032,400 | $367,100 | $665,300 |
| 2020 | $10,533 | $997,400 | $355,000 | $642,400 |
| 2019 | $9,558 | $906,800 | $268,200 | $638,600 |
| 2018 | $8,880 | $847,300 | $268,200 | $579,100 |
| 2017 | $8,542 | $806,600 | $268,200 | $538,400 |
| 2016 | $8,293 | $753,900 | $268,200 | $485,700 |
| 2015 | $8,059 | $665,500 | $253,800 | $411,700 |
| 2014 | $7,530 | $598,600 | $253,800 | $344,800 |
Source: Public Records
Map
Nearby Homes
- 46 High St
- 56 High St Unit 3
- 5 Wallace Ct
- 17 Henley St Unit F
- 17 Henley St Unit B
- 172 Bunker Hill St Unit 1
- 1 Washington Place
- 106 Bunker Hill St Unit 2
- 106 Bunker Hill St Unit 6
- 106 Bunker Hill St Unit 1
- 106 Bunker Hill St Unit 4P
- 106 Bunker Hill St Unit 3
- 22 Harvard St
- 12 Prospect St Unit 2
- 12 Prospect St Unit 1
- 207 Bunker Hill St Unit 2
- 73 Chelsea St Unit 401
- 9 Russell St Unit 2
- 9 Russell St Unit 1
- 15 Russell St
- 15 Cedar St
- 15 Cedar St Unit 2
- 9 Cedar St
- 9 Cedar St Unit 2
- 9 Cedar St Unit 1
- 2 Laurel St
- 1 Laurel St
- 7 Cedar St Unit 3
- 7 Cedar St Unit 2
- 7 Cedar St Unit 1
- 33 Monument Square
- 33 Monument Square Unit 1
- 32 Monument Square
- 32 Monument Square Unit 1
- 32 Monument Square Unit 3
- 5 Cedar St Unit 3
- 5 Cedar St Unit 2
- 5 Cedar St Unit 1
- 5 Cedar St Unit 1,5
- 10 Cedar St