15 Chandon Ct Rancho Mirage, CA 92270
Estimated Value: $1,000,000 - $1,017,000
3
Beds
3
Baths
3,333
Sq Ft
$302/Sq Ft
Est. Value
About This Home
This home is located at 15 Chandon Ct, Rancho Mirage, CA 92270 and is currently estimated at $1,008,156, approximately $302 per square foot. 15 Chandon Ct is a home located in Riverside County with nearby schools including Rancho Mirage Elementary School, Nellie N. Coffman Middle School, and Rancho Mirage High.
Ownership History
Date
Name
Owned For
Owner Type
Purchase Details
Closed on
Nov 2, 2012
Sold by
Kaplan Jeff and Kaplan Lori
Bought by
Kaplan Jeff and Kaplan Lori
Current Estimated Value
Purchase Details
Closed on
Mar 2, 2011
Sold by
Solomon Peter
Bought by
Peter Solomon Inc
Purchase Details
Closed on
Feb 16, 2010
Sold by
Necula George and Necula Antoaneta
Bought by
Mahdavi Hessam
Home Financials for this Owner
Home Financials are based on the most recent Mortgage that was taken out on this home.
Original Mortgage
$356,000
Interest Rate
4.94%
Mortgage Type
New Conventional
Purchase Details
Closed on
Jun 3, 2005
Sold by
Peter Solomon Inc
Bought by
Necula George and Necula Antoaneta
Home Financials for this Owner
Home Financials are based on the most recent Mortgage that was taken out on this home.
Original Mortgage
$584,680
Interest Rate
7.12%
Mortgage Type
Negative Amortization
Create a Home Valuation Report for This Property
The Home Valuation Report is an in-depth analysis detailing your home's value as well as a comparison with similar homes in the area
Home Values in the Area
Average Home Value in this Area
Purchase History
| Date | Buyer | Sale Price | Title Company |
|---|---|---|---|
| Kaplan Jeff | -- | None Available | |
| Peter Solomon Inc | -- | Orange Coast Title Company B | |
| Mahdavi Hessam | $445,000 | Orange Coast Title Co | |
| Necula George | $731,000 | Orange Coast Title San Berna | |
| Peter Solomon Inc | -- | Orange Coast Title Company |
Source: Public Records
Mortgage History
| Date | Status | Borrower | Loan Amount |
|---|---|---|---|
| Previous Owner | Mahdavi Hessam | $356,000 | |
| Previous Owner | Necula George | $584,680 |
Source: Public Records
Tax History Compared to Growth
Tax History
| Year | Tax Paid | Tax Assessment Tax Assessment Total Assessment is a certain percentage of the fair market value that is determined by local assessors to be the total taxable value of land and additions on the property. | Land | Improvement |
|---|---|---|---|---|
| 2025 | $7,987 | $574,397 | $143,595 | $430,802 |
| 2023 | $7,987 | $552,094 | $138,020 | $414,074 |
| 2022 | $7,783 | $541,269 | $135,314 | $405,955 |
| 2021 | $7,607 | $530,657 | $132,661 | $397,996 |
| 2020 | $7,274 | $525,217 | $131,301 | $393,916 |
| 2019 | $7,237 | $514,920 | $128,727 | $386,193 |
| 2018 | $7,024 | $504,824 | $126,203 | $378,621 |
| 2017 | $6,958 | $494,927 | $123,729 | $371,198 |
| 2016 | $6,726 | $485,223 | $121,303 | $363,920 |
| 2015 | $6,525 | $477,936 | $119,482 | $358,454 |
| 2014 | $6,518 | $468,577 | $117,143 | $351,434 |
Source: Public Records
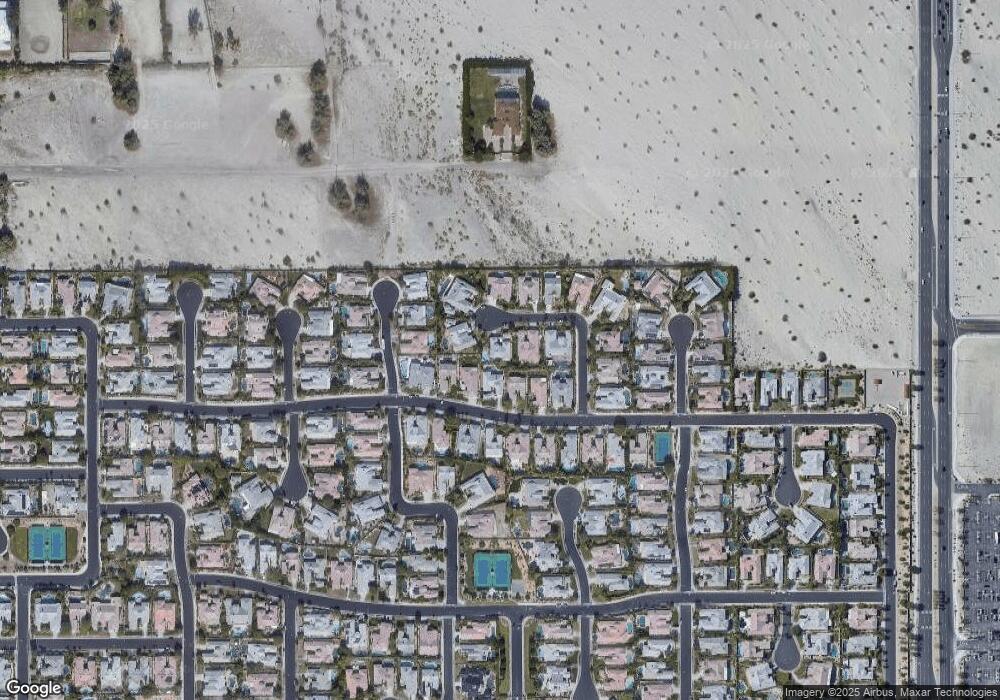
Map
Nearby Homes
- 6 Voltaire Ct
- 24 Paris Way
- 6 Champagne Cir
- 3 Monet Ct
- 4 Heliotrope Ave Unit Lot 299
- 5 Violet View Way Unit Lot 308
- 8 Heliotrope Ave Unit Lot 301
- 10 Heliotrope Ave Unit Lot 302
- 18 Calais Cir
- 9 Heliotrope Ave Unit Lot 306
- 11 Alicante Cir
- 14 Via Linea
- The Westwind II Plan at Cotino - Oasis
- The Cielo II Plan at Cotino - Grand
- The Reverie II Plan at Cotino - Grand
- The Reverie Plan at Cotino - Grand
- The Sandstone Plan at Cotino - Aspiron
- The Cielo Plan at Cotino - Grand
- The Canvas II Plan at Cotino - Grand
- The Lyric II Plan at Cotino - Grand