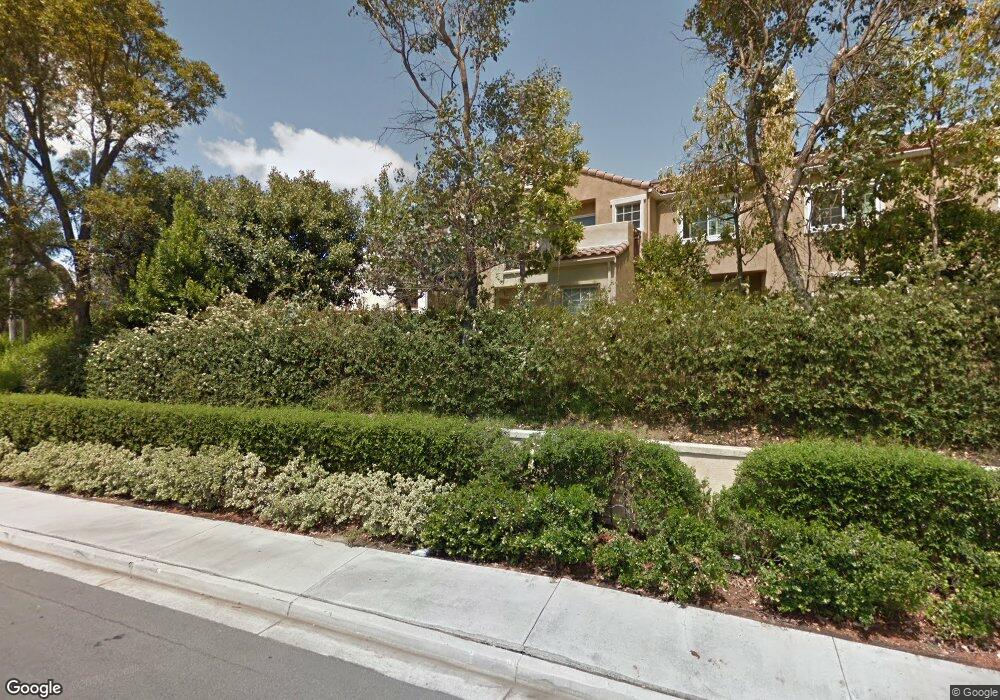
15 Chandon Laguna Niguel, CA 92677
Marina Hills NeighborhoodEstimated Value: $678,940 - $814,000
2
Beds
1
Bath
960
Sq Ft
$760/Sq Ft
Est. Value
About This Home
This home is located at 15 Chandon, Laguna Niguel, CA 92677 and is currently estimated at $729,735, approximately $760 per square foot. 15 Chandon is a home located in Orange County with nearby schools including George White Elementary, Niguel Hills Middle School, and Dana Hills High School.
Ownership History
Date
Name
Owned For
Owner Type
Purchase Details
Closed on
Jul 9, 2018
Sold by
Fisher Greg E and Fisher Gregory E
Bought by
Fisher Greg E and Fisher Rosemarle
Current Estimated Value
Home Financials for this Owner
Home Financials are based on the most recent Mortgage that was taken out on this home.
Original Mortgage
$343,000
Outstanding Balance
$297,918
Interest Rate
4.6%
Mortgage Type
New Conventional
Estimated Equity
$431,817
Purchase Details
Closed on
Dec 15, 2017
Sold by
Fisher Joanne E
Bought by
Eisher Joanne E
Purchase Details
Closed on
Dec 13, 2017
Sold by
Fisher Joanne E
Bought by
Fisher Gregory E
Purchase Details
Closed on
Oct 4, 2016
Sold by
Fisher Joanne E
Bought by
Fisher Joanne E and Fisher Family Trust
Purchase Details
Closed on
Apr 3, 1995
Sold by
Fisher Liberti M
Bought by
Fisher Liberti M
Create a Home Valuation Report for This Property
The Home Valuation Report is an in-depth analysis detailing your home's value as well as a comparison with similar homes in the area
Home Values in the Area
Average Home Value in this Area
Purchase History
| Date | Buyer | Sale Price | Title Company |
|---|---|---|---|
| Fisher Greg E | -- | Old Republic Title Co | |
| Eisher Joanne E | -- | First American Title Co | |
| Fisher Gregory E | -- | First American Title Ins Co | |
| Fisher Joanne E | -- | None Available | |
| Fisher Joanne E | -- | None Available | |
| Fisher Liberti M | -- | -- |
Source: Public Records
Mortgage History
| Date | Status | Borrower | Loan Amount |
|---|---|---|---|
| Open | Fisher Greg E | $343,000 |
Source: Public Records
Tax History Compared to Growth
Tax History
| Year | Tax Paid | Tax Assessment Tax Assessment Total Assessment is a certain percentage of the fair market value that is determined by local assessors to be the total taxable value of land and additions on the property. | Land | Improvement |
|---|---|---|---|---|
| 2025 | $2,784 | $286,290 | $130,256 | $156,034 |
| 2024 | $2,784 | $280,677 | $127,702 | $152,975 |
| 2023 | $2,724 | $275,174 | $125,198 | $149,976 |
| 2022 | $2,671 | $269,779 | $122,743 | $147,036 |
| 2021 | $2,618 | $264,490 | $120,337 | $144,153 |
| 2020 | $2,591 | $261,778 | $119,103 | $142,675 |
| 2019 | $2,539 | $256,646 | $116,768 | $139,878 |
| 2018 | $2,489 | $251,614 | $114,478 | $137,136 |
| 2017 | $2,510 | $246,681 | $112,233 | $134,448 |
| 2016 | $2,045 | $207,667 | $92,201 | $115,466 |
| 2015 | $2,013 | $204,548 | $90,816 | $113,732 |
| 2014 | $1,973 | $200,542 | $89,037 | $111,505 |
Source: Public Records
Map
Nearby Homes