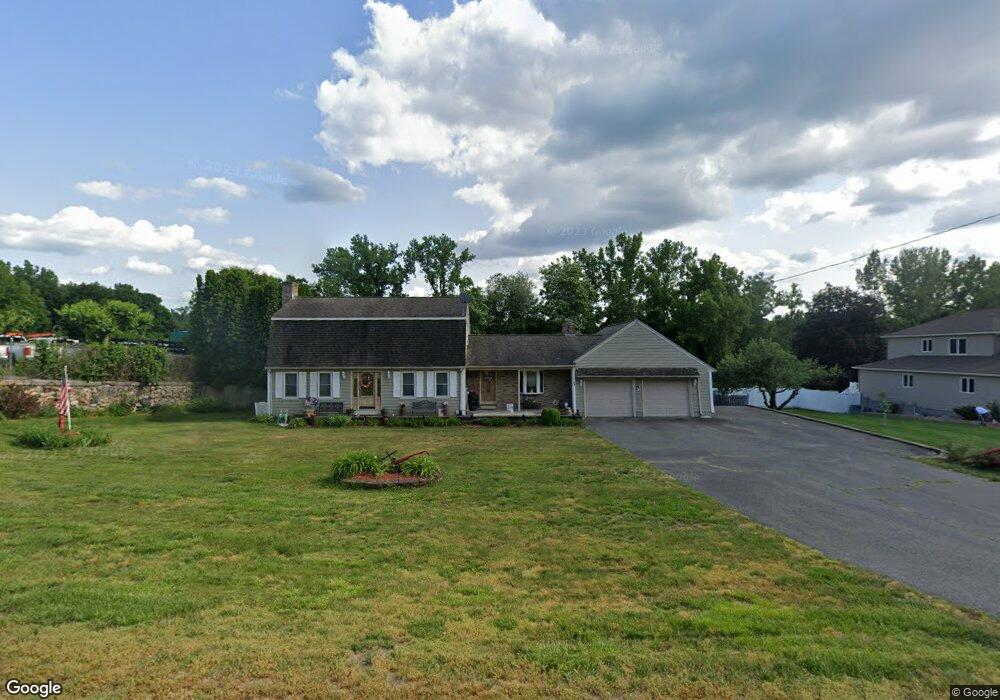
15 Chapin St Ludlow, MA 01056
Estimated Value: $451,000 - $513,000
4
Beds
3
Baths
2,023
Sq Ft
$238/Sq Ft
Est. Value
About This Home
This home is located at 15 Chapin St, Ludlow, MA 01056 and is currently estimated at $481,229, approximately $237 per square foot. 15 Chapin St is a home located in Hampden County with nearby schools including East Street Elementary School, Chapin Street Elementary School, and Paul R. Baird Middle School.
Ownership History
Date
Name
Owned For
Owner Type
Purchase Details
Closed on
Jun 26, 2006
Sold by
Corsi Diane M and Corsi Richard J
Bought by
Leibold Melanie K and Leibold Robert A
Current Estimated Value
Home Financials for this Owner
Home Financials are based on the most recent Mortgage that was taken out on this home.
Original Mortgage
$100,000
Outstanding Balance
$60,710
Interest Rate
6.59%
Mortgage Type
Purchase Money Mortgage
Estimated Equity
$410,218
Purchase Details
Closed on
Apr 21, 2005
Sold by
Shields James S and Citibank Na
Bought by
Corsi Diane M and Corsi Richard J
Purchase Details
Closed on
Jan 11, 1999
Sold by
Zucco Frank J
Bought by
Shields James S
Purchase Details
Closed on
Mar 25, 1994
Sold by
Stewart Marsha D and Stewart Walter A
Bought by
Zucco Frank J
Create a Home Valuation Report for This Property
The Home Valuation Report is an in-depth analysis detailing your home's value as well as a comparison with similar homes in the area
Home Values in the Area
Average Home Value in this Area
Purchase History
| Date | Buyer | Sale Price | Title Company |
|---|---|---|---|
| Leibold Melanie K | $299,000 | -- | |
| Leibold Melanie K | $299,000 | -- | |
| Corsi Diane M | $219,000 | -- | |
| Corsi Diane M | $219,000 | -- | |
| Shields James S | $147,000 | -- | |
| Shields James S | $147,000 | -- | |
| Zucco Frank J | $155,000 | -- | |
| Zucco Frank J | $155,000 | -- |
Source: Public Records
Mortgage History
| Date | Status | Borrower | Loan Amount |
|---|---|---|---|
| Open | Leibold Melanie K | $100,000 | |
| Closed | Zucco Frank J | $100,000 | |
| Previous Owner | Zucco Frank J | $152,000 |
Source: Public Records
Tax History Compared to Growth
Tax History
| Year | Tax Paid | Tax Assessment Tax Assessment Total Assessment is a certain percentage of the fair market value that is determined by local assessors to be the total taxable value of land and additions on the property. | Land | Improvement |
|---|---|---|---|---|
| 2025 | $5,769 | $332,500 | $75,200 | $257,300 |
| 2024 | $5,935 | $328,100 | $75,200 | $252,900 |
| 2023 | $6,536 | $335,000 | $62,500 | $272,500 |
| 2022 | $5,527 | $276,500 | $62,500 | $214,000 |
| 2021 | $5,557 | $263,600 | $62,500 | $201,100 |
| 2020 | $5,378 | $260,800 | $61,500 | $199,300 |
| 2019 | $5,110 | $257,800 | $61,000 | $196,800 |
| 2018 | $4,817 | $253,400 | $61,000 | $192,400 |
| 2017 | $4,734 | $255,500 | $62,100 | $193,400 |
| 2016 | $4,697 | $259,100 | $60,800 | $198,300 |
| 2015 | $4,449 | $257,300 | $60,200 | $197,100 |
Source: Public Records
Map
Nearby Homes
- 66 Voltage Ave
- 34 Longview Cir
- 238 Elizabeth Dr
- 20 Bartlett Ave
- 22 Balsam Hill Rd
- 319 Ventura St
- 229 Miller St Unit B2
- 229 Miller St Unit B-13
- 103 Main St
- 182 Mountain Rd
- 1172 East St
- 1 Sunset Rock Rd
- 50 Poole St
- 308 Miller St Unit 72
- 308 Miller St Unit 79
- 308 Miller St Unit 77
- 308 Miller St Unit 76
- 308 Miller St Unit 78
- 56 High Pine Cir
- 225 Maynard Rd