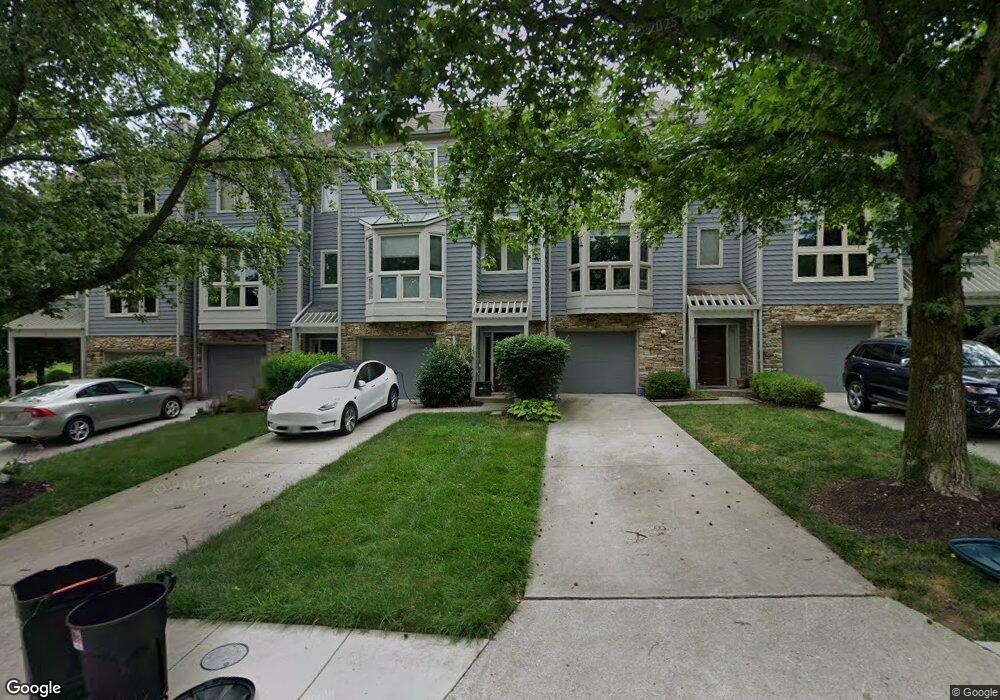
15 Chasemount Ct Baltimore, MD 21209
Estimated Value: $446,000 - $507,000
3
Beds
2
Baths
1,680
Sq Ft
$277/Sq Ft
Est. Value
About This Home
This home is located at 15 Chasemount Ct, Baltimore, MD 21209 and is currently estimated at $465,475, approximately $277 per square foot. 15 Chasemount Ct is a home located in Baltimore County with nearby schools including Summit Park Elementary, Pikesville Middle School, and Pikesville High School.
Ownership History
Date
Name
Owned For
Owner Type
Purchase Details
Closed on
Aug 31, 2015
Sold by
Black Eric and Black Lily
Bought by
Blackrock Realty Llc
Current Estimated Value
Purchase Details
Closed on
Jun 29, 2015
Sold by
Heyman
Bought by
Black Eric and Black Lily
Home Financials for this Owner
Home Financials are based on the most recent Mortgage that was taken out on this home.
Original Mortgage
$221,000
Interest Rate
3.88%
Mortgage Type
New Conventional
Purchase Details
Closed on
Mar 10, 2005
Sold by
Kazin Moshe
Bought by
Heyman Tracy K
Home Financials for this Owner
Home Financials are based on the most recent Mortgage that was taken out on this home.
Original Mortgage
$272,000
Interest Rate
5.75%
Mortgage Type
New Conventional
Purchase Details
Closed on
Feb 5, 1999
Sold by
Platt Hilary Gerald
Bought by
Kazin Moshe
Purchase Details
Closed on
Jan 3, 1991
Sold by
Capital Homes In C
Bought by
Platt Hilary Gerald
Create a Home Valuation Report for This Property
The Home Valuation Report is an in-depth analysis detailing your home's value as well as a comparison with similar homes in the area
Home Values in the Area
Average Home Value in this Area
Purchase History
| Date | Buyer | Sale Price | Title Company |
|---|---|---|---|
| Blackrock Realty Llc | -- | Attorney | |
| Black Eric | $221,000 | Terrain Title & Escrow | |
| Heyman Tracy K | $340,000 | -- | |
| Kazin Moshe | $175,000 | -- | |
| Platt Hilary Gerald | $178,000 | -- |
Source: Public Records
Mortgage History
| Date | Status | Borrower | Loan Amount |
|---|---|---|---|
| Previous Owner | Black Eric | $221,000 | |
| Previous Owner | Heyman Tracy K | $272,000 |
Source: Public Records
Tax History Compared to Growth
Tax History
| Year | Tax Paid | Tax Assessment Tax Assessment Total Assessment is a certain percentage of the fair market value that is determined by local assessors to be the total taxable value of land and additions on the property. | Land | Improvement |
|---|---|---|---|---|
| 2025 | $5,134 | $352,800 | $110,000 | $242,800 |
| 2024 | $5,134 | $339,400 | $0 | $0 |
| 2023 | $4,891 | $326,000 | $0 | $0 |
| 2022 | $4,763 | $312,600 | $110,000 | $202,600 |
| 2021 | $4,957 | $307,967 | $0 | $0 |
| 2020 | $4,957 | $303,333 | $0 | $0 |
| 2019 | $4,636 | $298,700 | $110,000 | $188,700 |
| 2018 | $4,248 | $288,300 | $0 | $0 |
| 2017 | $3,748 | $277,900 | $0 | $0 |
| 2016 | $3,566 | $267,500 | $0 | $0 |
| 2015 | $3,566 | $267,500 | $0 | $0 |
| 2014 | $3,566 | $267,500 | $0 | $0 |
Source: Public Records
Map
Nearby Homes
- 2419 Sylvale Rd
- 46 Stridesham Ct
- 2436 Smith Ave
- 2607 Smith Ave
- 6808 Timberlane Rd
- 11 Mica Ct
- 2319 Mellow Ct
- 2509 Hal Cir
- 6832 Hayley Ridge Way
- 3133 Katewood Ct
- 3137 Katewood Ct
- 2837 Katewood Ct Unit 6
- 2720 Quarry Heights Way
- 7400 Travertine Dr Unit 106
- 2907 Lightfoot Dr
- 2906 Oakton Ct
- 2 Tyler Falls Ct Unit B
- 6311 Ivymount Rd
- 33 Jones Valley Cir
- 18 Hambleton Ct
- 17 Chasemount Ct
- 13 Chasemount Ct
- 11 Chasemount Ct
- 19 Chasemount Ct
- 9 Chasemount Ct
- 24 Stablemere Ct
- 22 Stablemere Ct
- 21 Chasemount Ct
- 20 Stablemere Ct
- 26 Stablemere Ct
- 18 Stablemere Ct
- 16 Stablemere Ct
- 28 Stablemere Ct
- 7 Chasemount Ct
- 23 Chasemount Ct
- 30 Stablemere Ct
- 14 Stablemere Ct
- 5 Chasemount Ct
- 25 Chasemount Ct
- 32 Stablemere Ct