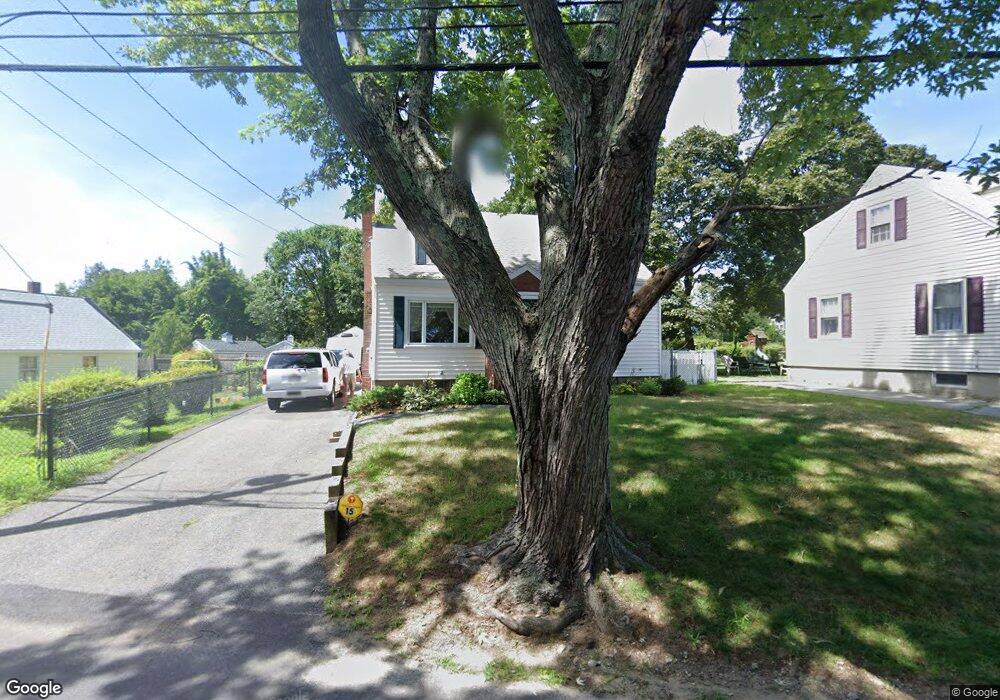
15 Chickering St Lawrence, MA 01843
Colonial Heights NeighborhoodEstimated Value: $460,000 - $560,000
3
Beds
2
Baths
1,440
Sq Ft
$364/Sq Ft
Est. Value
About This Home
This home is located at 15 Chickering St, Lawrence, MA 01843 and is currently estimated at $524,139, approximately $363 per square foot. 15 Chickering St is a home located in Essex County with nearby schools including Vardaman Elementary School, Olive Branch Elementary School, and Rowan Elementary School.
Ownership History
Date
Name
Owned For
Owner Type
Purchase Details
Closed on
Jul 29, 2004
Sold by
Hamilton Martin J and Hamilton Ruth A
Bought by
Lumsden Debora E
Current Estimated Value
Home Financials for this Owner
Home Financials are based on the most recent Mortgage that was taken out on this home.
Original Mortgage
$192,000
Outstanding Balance
$97,289
Interest Rate
6.33%
Mortgage Type
Purchase Money Mortgage
Estimated Equity
$426,850
Create a Home Valuation Report for This Property
The Home Valuation Report is an in-depth analysis detailing your home's value as well as a comparison with similar homes in the area
Home Values in the Area
Average Home Value in this Area
Purchase History
| Date | Buyer | Sale Price | Title Company |
|---|---|---|---|
| Lumsden Debora E | $240,000 | -- |
Source: Public Records
Mortgage History
| Date | Status | Borrower | Loan Amount |
|---|---|---|---|
| Open | Lumsden Debora E | $192,000 |
Source: Public Records
Tax History Compared to Growth
Tax History
| Year | Tax Paid | Tax Assessment Tax Assessment Total Assessment is a certain percentage of the fair market value that is determined by local assessors to be the total taxable value of land and additions on the property. | Land | Improvement |
|---|---|---|---|---|
| 2025 | $3,788 | $430,500 | $135,300 | $295,200 |
| 2024 | $3,550 | $383,800 | $118,600 | $265,200 |
| 2023 | $3,735 | $367,600 | $118,600 | $249,000 |
| 2022 | $3,612 | $315,700 | $105,700 | $210,000 |
| 2021 | $3,345 | $272,600 | $102,200 | $170,400 |
| 2020 | $3,130 | $251,800 | $87,600 | $164,200 |
| 2019 | $3,230 | $236,100 | $90,900 | $145,200 |
| 2018 | $3,133 | $218,800 | $89,200 | $129,600 |
| 2017 | $3,008 | $196,100 | $86,800 | $109,300 |
| 2016 | $2,674 | $172,400 | $62,000 | $110,400 |
| 2015 | $2,481 | $164,100 | $53,700 | $110,400 |
Source: Public Records
Map
Nearby Homes
- 5 Lafayette Ave
- 437 N Main St Unit C
- 356-360 S Union St
- 27-29 Dorchester St
- 57 Glenwood St
- 24 Inman St Unit 32
- 31 Garfield St
- 102 Weare St
- 34 Leeds Terrace
- 78-80 Osgood St
- 67-69 Osgood St
- 77-79 Shawsheen Rd
- 91 Farnham St
- 5 W Kenneth St
- 11 W Hawley St
- 64 Salem St
- 317 Middlesex St
- 33 Herrick Rd
- 46 Loring St
- 33 Jefferson St