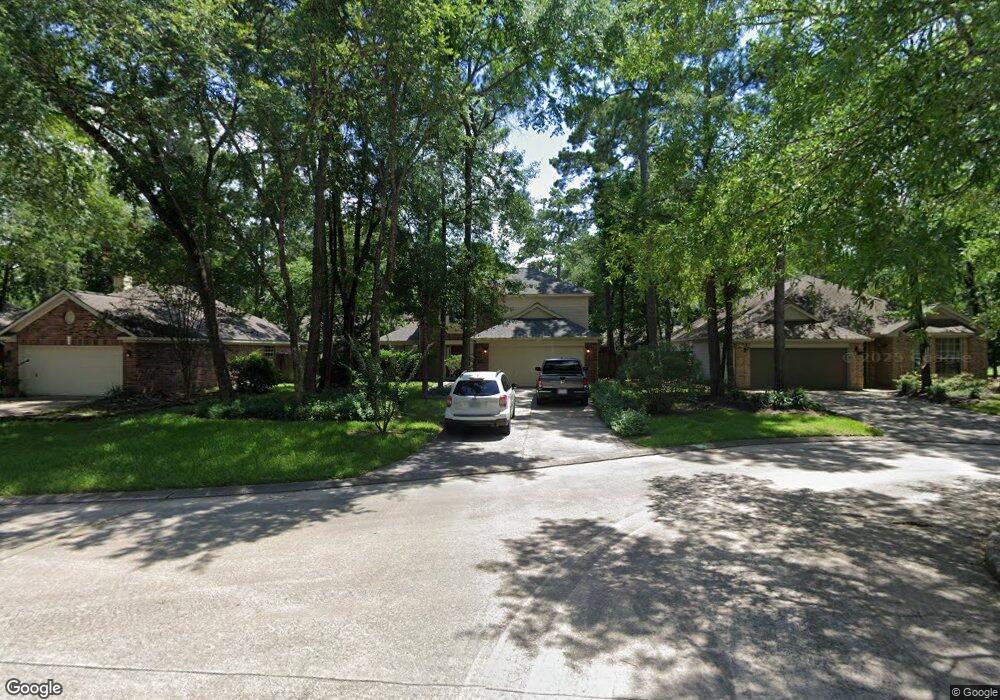
15 Cirrus Ct Spring, TX 77380
Grogan's Mill NeighborhoodEstimated Value: $343,000 - $390,000
Studio
3
Baths
2,004
Sq Ft
$184/Sq Ft
Est. Value
About This Home
This home is located at 15 Cirrus Ct, Spring, TX 77380 and is currently estimated at $369,290, approximately $184 per square foot. 15 Cirrus Ct is a home located in Montgomery County with nearby schools including Hailey Elementary School, W.D Wilkerson Intermediate School, and Knox J High School.
Ownership History
Date
Name
Owned For
Owner Type
Purchase Details
Closed on
May 16, 2023
Sold by
Salivia Rick
Bought by
Rick And Lena Salivia Revocable Trust
Current Estimated Value
Purchase Details
Closed on
Aug 21, 2018
Sold by
Zhao Liang and Li Xueing
Bought by
Salivia Rick and Salivia Lena S
Purchase Details
Closed on
Apr 28, 2000
Sold by
Mattox Steven H
Bought by
Salivia Rick and Pettersson Lena S
Home Financials for this Owner
Home Financials are based on the most recent Mortgage that was taken out on this home.
Original Mortgage
$133,896
Interest Rate
8.21%
Mortgage Type
FHA
Purchase Details
Closed on
May 24, 1996
Sold by
Federal National Mortgage Association
Bought by
Mattox Steven H
Home Financials for this Owner
Home Financials are based on the most recent Mortgage that was taken out on this home.
Original Mortgage
$103,500
Interest Rate
7.93%
Mortgage Type
Purchase Money Mortgage
Purchase Details
Closed on
Feb 6, 1996
Sold by
Blasing John R and Blasing Karen A
Bought by
Ryland Mtg Company
Purchase Details
Closed on
Dec 13, 1994
Sold by
Blasing John R and Blasing Karen A
Bought by
Ryland Mtg Company
Purchase Details
Closed on
Jul 14, 1992
Sold by
Woodlands Land Dev Lp
Bought by
Salivia Rick
Create a Home Valuation Report for This Property
The Home Valuation Report is an in-depth analysis detailing your home's value as well as a comparison with similar homes in the area
Home Values in the Area
Average Home Value in this Area
Purchase History
| Date | Buyer | Sale Price | Title Company |
|---|---|---|---|
| Rick And Lena Salivia Revocable Trust | -- | None Listed On Document | |
| Salivia Rick | -- | Great American Title Co | |
| Salivia Rick | -- | Stewart Title | |
| Mattox Steven H | -- | -- | |
| Ryland Mtg Company | $104,947 | -- | |
| Ryland Mtg Company | -- | -- | |
| Salivia Rick | -- | -- |
Source: Public Records
Mortgage History
| Date | Status | Borrower | Loan Amount |
|---|---|---|---|
| Previous Owner | Salivia Rick | $133,896 | |
| Previous Owner | Mattox Steven H | $103,500 |
Source: Public Records
Tax History
| Year | Tax Paid | Tax Assessment Tax Assessment Total Assessment is a certain percentage of the fair market value that is determined by local assessors to be the total taxable value of land and additions on the property. | Land | Improvement |
|---|---|---|---|---|
| 2025 | $3,689 | $336,235 | -- | -- |
| 2024 | $3,797 | $305,668 | -- | -- |
| 2023 | $3,797 | $277,880 | $50,000 | $264,700 |
| 2022 | $5,105 | $252,620 | $50,000 | $229,850 |
| 2021 | $5,010 | $229,650 | $15,000 | $214,650 |
| 2020 | $5,413 | $237,630 | $15,000 | $227,110 |
| 2019 | $5,086 | $216,030 | $15,000 | $201,030 |
| 2018 | $4,441 | $216,030 | $15,000 | $201,030 |
| 2017 | $5,149 | $216,030 | $15,000 | $201,030 |
| 2016 | $5,118 | $214,720 | $15,000 | $216,830 |
| 2015 | $4,092 | $195,200 | $15,000 | $209,570 |
| 2014 | $4,092 | $177,450 | $15,000 | $162,450 |
Source: Public Records
Map
Nearby Homes
- 19 Tulip Hill Ct
- 22 Camberwell Ct
- 9 S Brook Pebble Ct
- 19 Evening Song Ct
- 37 Rockfern Ct
- 34 Green Bough Ct
- 22 S Rain Forest Ct
- 3 Rain Walk Ct
- 56 N Morningwood Ct
- 49 Country Forest Ct
- 10 S Greenbud Ct
- 8 N Greenbud Ct
- 2005 Carlson Creek Dr
- 118 Angel Leaf Rd
- 205 Grogans Point Rd
- 4 Sawmill Grove Ln
- 25234 Calhoun Creek Dr
- 12224 Gun Oak Place
- 1 Laurel Oak Place
- 1237 Pruitt Rd
- 11 Cirrus Ct
- 19 Cirrus Ct
- 14 Crested Cloud Ct
- 10 Crested Cloud Ct
- 7 Cirrus Ct
- 18 Crested Cloud Ct
- 6 Crested Cloud Ct
- 14 Cirrus Ct
- 10 Cirrus Ct
- 3 Cirrus Ct
- 18 Cirrus Ct
- 2 Crested Cloud Ct
- 2 Cirrus Ct
- 11 Crested Cloud Ct
- 67 N Elm Branch Place
- 15 Crested Cloud Ct
- 71 N Elm Branch Place
- 3 Crested Cloud Ct
- 71 N Elm Branch Place
- 54 Elm Branch Ct
Your Personal Tour Guide
Ask me questions while you tour the home.