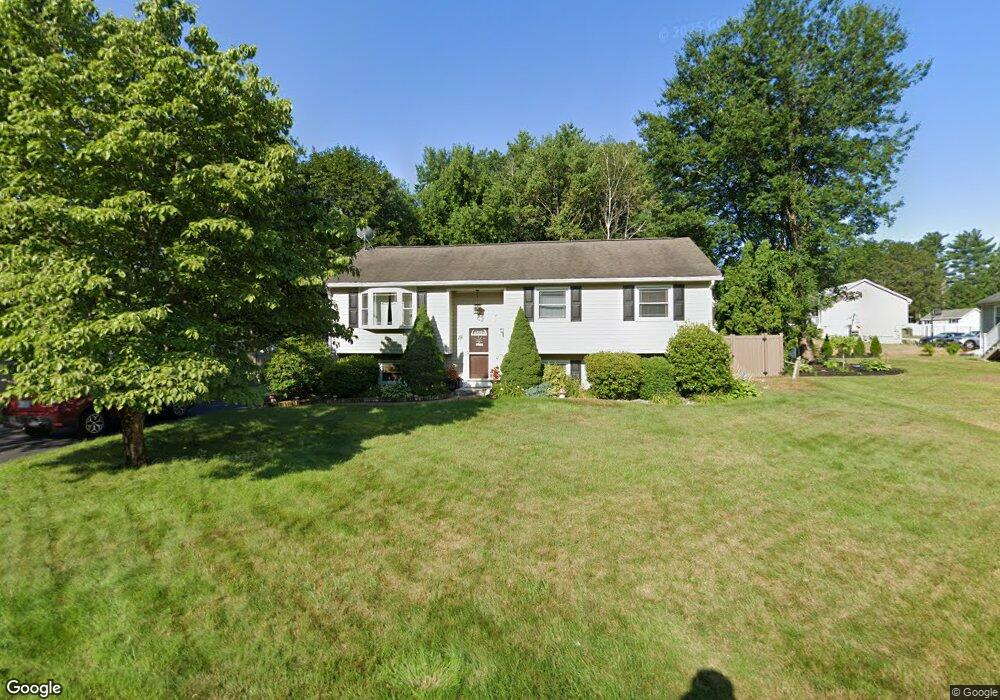
15 Conifer St Merrimack, NH 03054
Estimated Value: $536,061 - $568,000
4
Beds
2
Baths
2,112
Sq Ft
$261/Sq Ft
Est. Value
About This Home
This home is located at 15 Conifer St, Merrimack, NH 03054 and is currently estimated at $552,015, approximately $261 per square foot. 15 Conifer St is a home located in Hillsborough County with nearby schools including James Mastricola Elementary School, James Mastricola Upper Elementary School, and Merrimack Middle School.
Ownership History
Date
Name
Owned For
Owner Type
Purchase Details
Closed on
Feb 15, 2012
Sold by
Andrews Paul F and Andrews Christina M
Bought by
Andrews Paul F and Andrews Christina M
Current Estimated Value
Home Financials for this Owner
Home Financials are based on the most recent Mortgage that was taken out on this home.
Original Mortgage
$212,000
Outstanding Balance
$140,713
Interest Rate
3.25%
Mortgage Type
FHA
Estimated Equity
$411,302
Purchase Details
Closed on
Jun 3, 2008
Sold by
Thorp Steven G and Thorp Kathryn D
Bought by
Andrews Paul Foster and Gligg Christina Marie
Home Financials for this Owner
Home Financials are based on the most recent Mortgage that was taken out on this home.
Original Mortgage
$235,000
Interest Rate
5.91%
Mortgage Type
Purchase Money Mortgage
Purchase Details
Closed on
Jul 28, 2000
Sold by
Chasse Stephen L
Bought by
Thorp Steven G and Thorp Kathryn D
Purchase Details
Closed on
Apr 30, 1997
Sold by
Rossi James L and Rossi Kathy A
Bought by
Chasse Stephen L
Create a Home Valuation Report for This Property
The Home Valuation Report is an in-depth analysis detailing your home's value as well as a comparison with similar homes in the area
Home Values in the Area
Average Home Value in this Area
Purchase History
| Date | Buyer | Sale Price | Title Company |
|---|---|---|---|
| Andrews Paul F | -- | -- | |
| Andrews Paul Foster | $255,000 | -- | |
| Thorp Steven G | $153,000 | -- | |
| Chasse Stephen L | $123,100 | -- |
Source: Public Records
Mortgage History
| Date | Status | Borrower | Loan Amount |
|---|---|---|---|
| Open | Andrews Paul F | $212,000 | |
| Previous Owner | Chasse Stephen L | $235,000 | |
| Previous Owner | Chasse Stephen L | $55,000 | |
| Previous Owner | Chasse Stephen L | $234,400 | |
| Previous Owner | Chasse Stephen L | $10,000 |
Source: Public Records
Tax History Compared to Growth
Tax History
| Year | Tax Paid | Tax Assessment Tax Assessment Total Assessment is a certain percentage of the fair market value that is determined by local assessors to be the total taxable value of land and additions on the property. | Land | Improvement |
|---|---|---|---|---|
| 2024 | $7,184 | $347,200 | $176,200 | $171,000 |
| 2023 | $6,753 | $347,200 | $176,200 | $171,000 |
| 2022 | $6,034 | $347,200 | $176,200 | $171,000 |
| 2021 | $5,961 | $347,200 | $176,200 | $171,000 |
| 2020 | $6,203 | $257,800 | $137,700 | $120,100 |
| 2019 | $6,221 | $257,800 | $137,700 | $120,100 |
| 2018 | $6,218 | $257,800 | $137,700 | $120,100 |
| 2017 | $6,025 | $257,800 | $137,700 | $120,100 |
| 2016 | $5,875 | $257,800 | $137,700 | $120,100 |
| 2015 | $5,367 | $217,100 | $114,700 | $102,400 |
| 2014 | $5,230 | $217,100 | $114,700 | $102,400 |
| 2013 | $5,102 | $213,400 | $114,700 | $98,700 |
Source: Public Records
Map
Nearby Homes
- 7 Beacon Dr
- 14 Mayflower Dr
- 3 Independence Dr
- 40 Turkey Hill Rd
- 5 Fernwood Dr
- 98 Indian Rock Rd
- 8 Highland Green Ln
- 7 Hadley Rd
- 27 Sarah Dr
- 22 Clay St
- 5 Lynn Dr
- 8 Donovan Ct
- 20 Jakes Ln
- 14 Silver Doe Ln
- 38 Mallard Point
- 40 Captain Bannon Cir
- 77 E Ridge Rd
- 23 Pondview Dr
- 12 Clinton Ct
- 22 Essex Green Ct