Estimated Value: $567,000 - $603,519
3
Beds
4
Baths
2,056
Sq Ft
$283/Sq Ft
Est. Value
About This Home
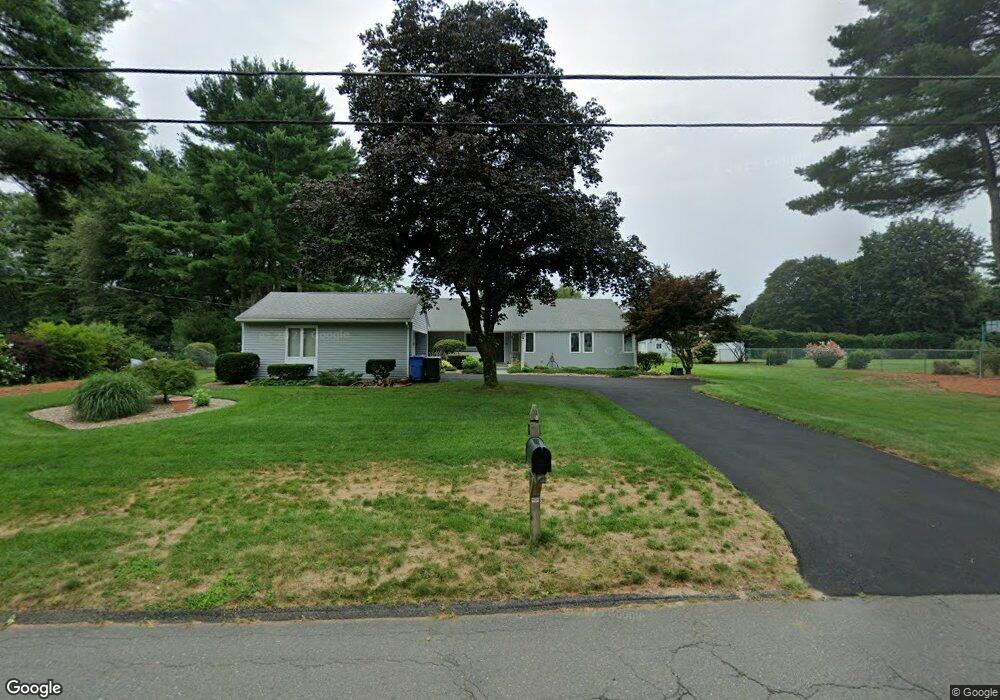
This home is located at 15 Craigemore Cir, Avon, CT 06001 and is currently estimated at $581,880, approximately $283 per square foot. 15 Craigemore Cir is a home located in Hartford County with nearby schools including Roaring Brook School, Thompson Brook School, and Avon Middle School.
Ownership History
Date
Name
Owned For
Owner Type
Purchase Details
Closed on
Jul 13, 1994
Sold by
Granger Edward and Granger Maria
Bought by
Campbell Mark and Campbell Carmela
Current Estimated Value
Create a Home Valuation Report for This Property
The Home Valuation Report is an in-depth analysis detailing your home's value as well as a comparison with similar homes in the area
Home Values in the Area
Average Home Value in this Area
Purchase History
| Date | Buyer | Sale Price | Title Company |
|---|---|---|---|
| Campbell Mark | $178,000 | -- | |
| Campbell Mark | $178,000 | -- |
Source: Public Records
Mortgage History
| Date | Status | Borrower | Loan Amount |
|---|---|---|---|
| Open | Campbell Mark | $255,000 | |
| Closed | Campbell Mark | $120,000 | |
| Closed | Campbell Mark | $172,000 |
Source: Public Records
Tax History Compared to Growth
Tax History
| Year | Tax Paid | Tax Assessment Tax Assessment Total Assessment is a certain percentage of the fair market value that is determined by local assessors to be the total taxable value of land and additions on the property. | Land | Improvement |
|---|---|---|---|---|
| 2025 | $9,222 | $299,910 | $94,500 | $205,410 |
| 2024 | $8,895 | $299,910 | $94,500 | $205,410 |
| 2023 | $8,483 | $239,700 | $87,500 | $152,200 |
| 2022 | $8,296 | $239,700 | $87,500 | $152,200 |
| 2021 | $8,200 | $239,700 | $87,500 | $152,200 |
| 2020 | $7,886 | $239,700 | $87,500 | $152,200 |
| 2019 | $7,886 | $239,700 | $87,500 | $152,200 |
| 2018 | $7,298 | $232,790 | $87,500 | $145,290 |
| 2017 | $7,121 | $232,790 | $87,500 | $145,290 |
| 2016 | $6,872 | $232,790 | $87,500 | $145,290 |
| 2015 | $6,704 | $232,790 | $87,500 | $145,290 |
| 2014 | $6,593 | $232,790 | $87,500 | $145,290 |
Source: Public Records
Map
Nearby Homes
- 114 Cold Spring Rd
- 30 Cliff Dr
- 143 Juniper Dr
- 18 Sunset Trail
- 20 Found Land Way
- 31 Stockbridge Dr
- 54 Secret Lake Rd
- 41 Secret Lake Rd
- 48 Weatherstone
- 61 Weatherstone
- 58 Weatherstone
- 3 Bridle Path
- 7 Woodmont Rd
- 4 Tanglewood Dr
- 25 Bolleswood Ln
- 28 Meadowview Ct Unit 28
- 187 W Avon Rd
- 20 Bart Dr
- 141 Dowd Ave
- 519 Dowd Ave Unit 519
- 19 Craigemore Cir
- 9 Craigemore Cir
- 18 Parkview Dr
- 12 Craigemore Cir
- 24 Parkview Dr
- 12 Parkview Dr
- 18 Craigemore Cir
- 3 Craigemore Cir
- 25 Craigemore Cir
- 4 Craigemore Cir
- 30 Parkview Dr
- 6 Parkview Dr
- 26 Craigemore Cir
- 104 Lovely St
- 33 Craigemore Cir
- 21 Parkview Dr
- 15 Parkview Dr
- 12 Brentwood Dr
- 36 Parkview Dr
- 27 Parkview Dr