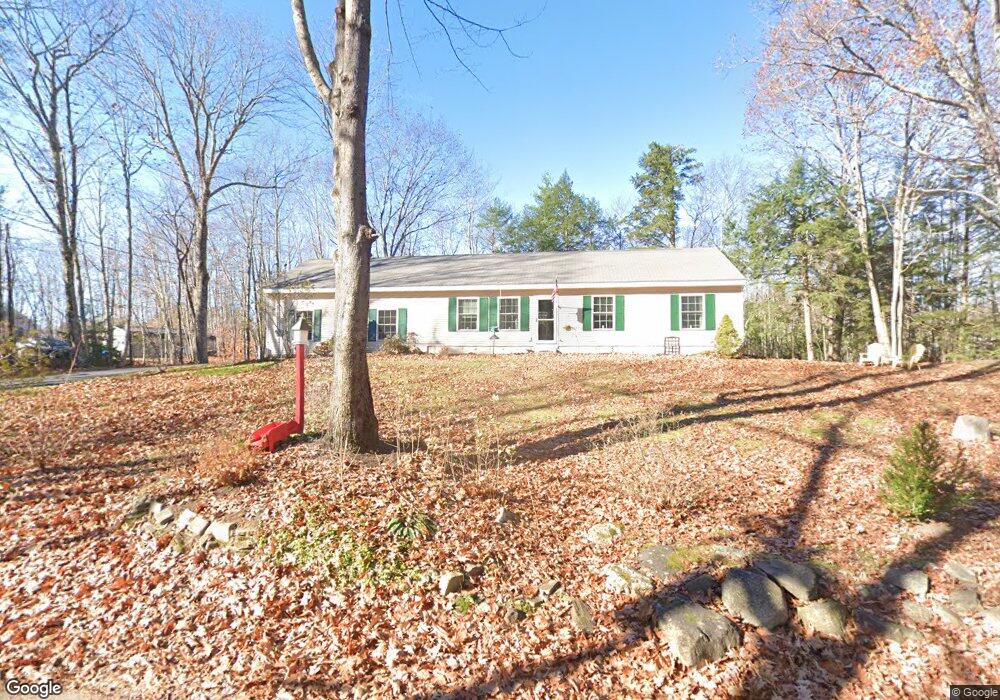
15 Cram Rd Standish, ME 04084
Estimated Value: $423,113 - $486,000
3
Beds
2
Baths
1,144
Sq Ft
$395/Sq Ft
Est. Value
About This Home
This home is located at 15 Cram Rd, Standish, ME 04084 and is currently estimated at $452,028, approximately $395 per square foot. 15 Cram Rd is a home located in Cumberland County with nearby schools including Bonny Eagle High School and Standish Baptist Academy.
Ownership History
Date
Name
Owned For
Owner Type
Purchase Details
Closed on
Mar 24, 2010
Sold by
Suntrust Mortgage Inc
Bought by
Federal National Mortgage Association
Current Estimated Value
Purchase Details
Closed on
Jun 2, 2006
Sold by
K Christensen Custom Hms
Bought by
Peppers Timothy
Home Financials for this Owner
Home Financials are based on the most recent Mortgage that was taken out on this home.
Original Mortgage
$240,000
Interest Rate
6.55%
Mortgage Type
Purchase Money Mortgage
Create a Home Valuation Report for This Property
The Home Valuation Report is an in-depth analysis detailing your home's value as well as a comparison with similar homes in the area
Home Values in the Area
Average Home Value in this Area
Purchase History
| Date | Buyer | Sale Price | Title Company |
|---|---|---|---|
| Federal National Mortgage Association | -- | -- | |
| Suntrust Mortgage Inc | -- | -- | |
| Peppers Timothy | -- | -- |
Source: Public Records
Mortgage History
| Date | Status | Borrower | Loan Amount |
|---|---|---|---|
| Open | Suntrust Mortgage Inc | $161,912 | |
| Previous Owner | Peppers Timothy | $240,000 |
Source: Public Records
Tax History
| Year | Tax Paid | Tax Assessment Tax Assessment Total Assessment is a certain percentage of the fair market value that is determined by local assessors to be the total taxable value of land and additions on the property. | Land | Improvement |
|---|---|---|---|---|
| 2024 | $3,903 | $309,800 | $49,000 | $260,800 |
| 2023 | $3,656 | $264,000 | $40,900 | $223,100 |
| 2022 | $3,105 | $214,900 | $36,200 | $178,700 |
| 2021 | $2,673 | $203,200 | $32,900 | $170,300 |
| 2019 | $2,826 | $197,600 | $32,100 | $165,500 |
| 2018 | $2,722 | $195,800 | $30,300 | $165,500 |
| 2017 | $2,580 | $194,700 | $30,300 | $164,400 |
| 2016 | $2,496 | $194,700 | $30,300 | $164,400 |
| 2015 | $2,490 | $194,700 | $30,300 | $164,400 |
| 2013 | -- | $211,100 | $30,300 | $180,800 |
Source: Public Records
Map
Nearby Homes
- 7 Macie Dr
- 11 Macie Dr Unit 79
- 1 Macie Dr Unit 84
- 1 Cortland Place Unit 7
- 4 Cortland Place Unit 3
- 324 Ossipee Trail W Unit 2
- 326 Ossipee Trail W Unit 3
- 328 Ossipee Trail W Unit 4
- 4 Macie Dr Unit 70
- 9 Macie Dr
- 27 Ossipee Trail E Unit 1
- 63 Ossipee Trail E
- 66 Ossipee Trail East Trail E
- 4 Blueberry Ln Unit 4
- 500 Ossipee Trail W
- 103 Kayli Dr
- 21 Holiday Ln
- 33 Woodbrey Ln
- 5 Holiday Ln
- 42 Brandons Way
Your Personal Tour Guide
Ask me questions while you tour the home.