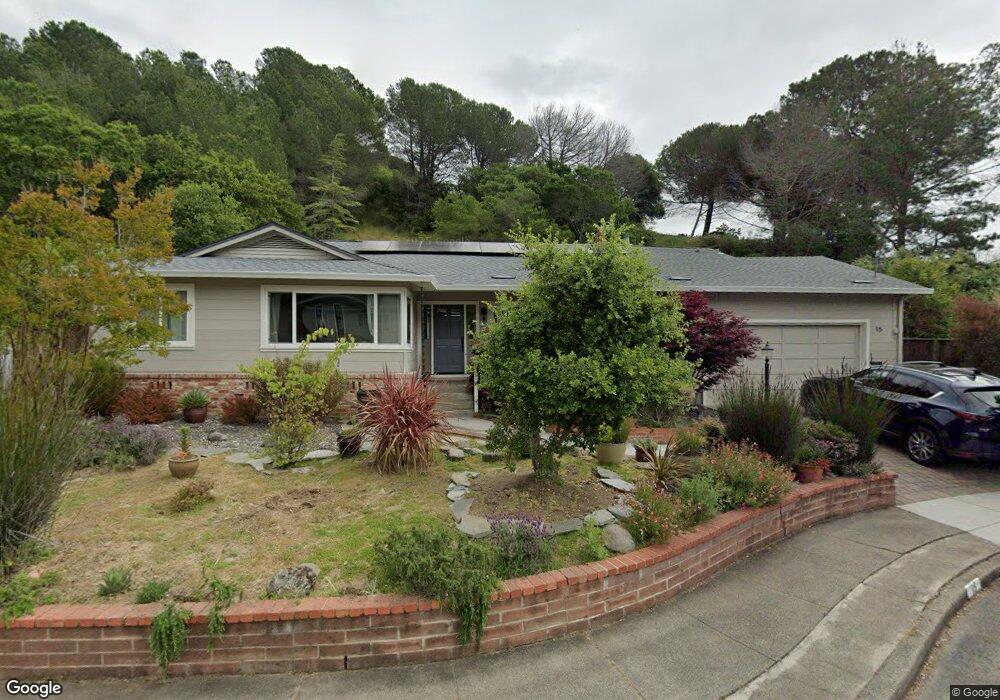
15 Crescent Cir Fairfax, CA 94930
Estimated Value: $1,208,000 - $1,586,000
3
Beds
3
Baths
1,666
Sq Ft
$825/Sq Ft
Est. Value
About This Home
This home is located at 15 Crescent Cir, Fairfax, CA 94930 and is currently estimated at $1,374,214, approximately $824 per square foot. 15 Crescent Cir is a home located in Marin County with nearby schools including Manor Elementary School, White Hill Middle School, and Archie Williams High School.
Ownership History
Date
Name
Owned For
Owner Type
Purchase Details
Closed on
Mar 7, 2022
Sold by
Kelemen --Michael A and Kelemen Amy C
Bought by
Michael And Amy Kelemen Living Trust and Kelemen
Current Estimated Value
Purchase Details
Closed on
Jul 20, 2005
Sold by
Millett Inge
Bought by
Kelemen Michael A and Kelemen Amy C
Home Financials for this Owner
Home Financials are based on the most recent Mortgage that was taken out on this home.
Original Mortgage
$230,000
Interest Rate
5.56%
Mortgage Type
Credit Line Revolving
Purchase Details
Closed on
Nov 16, 2004
Sold by
Millett Inge and Dabster Hilda Dykman
Bought by
Millett Inge
Purchase Details
Closed on
Mar 14, 1997
Sold by
Dykman Hilda B and Dykman Hilda
Bought by
Dabster Hilda Dykman
Create a Home Valuation Report for This Property
The Home Valuation Report is an in-depth analysis detailing your home's value as well as a comparison with similar homes in the area
Home Values in the Area
Average Home Value in this Area
Purchase History
We collect this data history from publicly available records. To have your information removed, we recommend requesting removal directly through your county’s website.
| Date | Buyer | Sale Price | Title Company |
|---|---|---|---|
| Michael And Amy Kelemen Living Trust | -- | None Listed On Document | |
| Kelemen Michael A | $800,000 | Fidelity National Title Co | |
| Millett Inge | -- | -- | |
| Dabster Hilda Dykman | -- | -- |
Source: Public Records
Mortgage History
We collect this data history from publicly available records. To have your information removed, we recommend requesting removal directly through your county’s website.
| Date | Status | Borrower | Loan Amount |
|---|---|---|---|
| Previous Owner | Kelemen Michael A | $230,000 | |
| Previous Owner | Kelemen Michael A | $410,000 |
Source: Public Records
Tax History
| Year | Tax Paid | Tax Assessment Tax Assessment Total Assessment is a certain percentage of the fair market value that is determined by local assessors to be the total taxable value of land and additions on the property. | Land | Improvement |
|---|---|---|---|---|
| 2025 | $16,784 | $1,093,167 | $735,155 | $358,012 |
| 2024 | $16,193 | $1,071,735 | $720,742 | $350,993 |
| 2023 | $16,001 | $1,050,727 | $706,614 | $344,113 |
| 2022 | $15,823 | $1,030,127 | $692,761 | $337,366 |
| 2021 | $15,477 | $1,009,935 | $679,181 | $330,754 |
| 2020 | $15,283 | $999,583 | $672,220 | $327,363 |
| 2019 | $14,837 | $979,991 | $659,044 | $320,947 |
| 2018 | $14,390 | $960,783 | $646,127 | $314,656 |
| 2017 | $14,024 | $934,500 | $644,700 | $289,800 |
| 2016 | $13,095 | $890,000 | $614,000 | $276,000 |
| 2015 | $10,879 | $701,180 | $483,733 | $217,447 |
| 2014 | $9,441 | $609,723 | $420,638 | $189,085 |
Source: Public Records
Map
Nearby Homes
- 9 Crescent Cir
- 19 Crescent Cir
- 32 San Miguel Ct
- 19 San Miguel Ct
- 12 Crescent Cir
- 2320 Sir Francis Drake Blvd
- 8 Crescent Cir
- 20 Oak Tree Ln
- 2316 Sir Francis Drake Blvd
- 15 San Miguel Ct
- 1 Crescent Cir
- 24 San Miguel Ct
- 24 Oak Tree Ln
- 2 Oak Tree Ln
- 9 Manor Rd
- 7 Manor Rd
- 15 Manor Rd
- 2310 Sir Francis Drake Blvd
- 28 Oak Tree Ln
- 17 Manor Rd
Your Personal Tour Guide
Ask me questions while you tour the home.