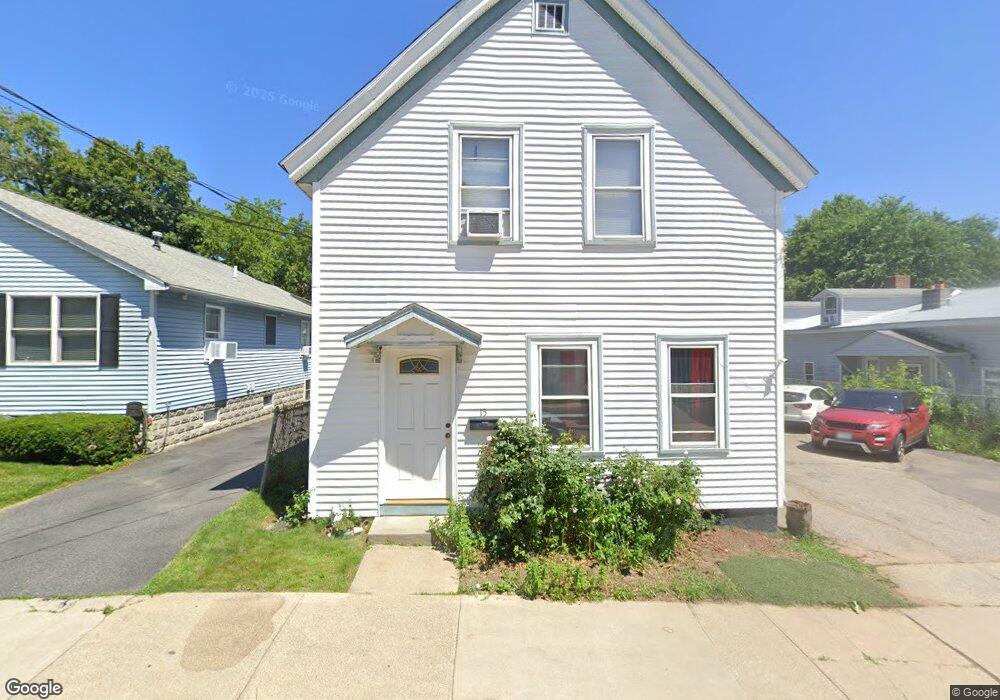
15 Cross St Nashua, NH 03064
North End Nashua NeighborhoodEstimated Value: $461,000 - $507,000
5
Beds
2
Baths
2,220
Sq Ft
$216/Sq Ft
Est. Value
About This Home
This home is located at 15 Cross St, Nashua, NH 03064 and is currently estimated at $479,441, approximately $215 per square foot. 15 Cross St is a home located in Hillsborough County with nearby schools including Mount Pleasant Elementary School, Pennichuck Middle School, and Nashua High School North.
Ownership History
Date
Name
Owned For
Owner Type
Purchase Details
Closed on
Oct 31, 2023
Sold by
Liriano Rafael M
Bought by
Almonte Rafael G and Almonte Gercy M
Current Estimated Value
Home Financials for this Owner
Home Financials are based on the most recent Mortgage that was taken out on this home.
Original Mortgage
$225,000
Outstanding Balance
$219,811
Interest Rate
7.19%
Mortgage Type
Purchase Money Mortgage
Estimated Equity
$259,630
Purchase Details
Closed on
Jul 30, 2004
Sold by
Blouin Henry J Est
Bought by
Liriano Rafael M
Home Financials for this Owner
Home Financials are based on the most recent Mortgage that was taken out on this home.
Original Mortgage
$210,000
Interest Rate
6.33%
Mortgage Type
Purchase Money Mortgage
Create a Home Valuation Report for This Property
The Home Valuation Report is an in-depth analysis detailing your home's value as well as a comparison with similar homes in the area
Home Values in the Area
Average Home Value in this Area
Purchase History
| Date | Buyer | Sale Price | Title Company |
|---|---|---|---|
| Almonte Rafael G | $325,000 | None Available | |
| Liriano Rafael M | $210,000 | -- |
Source: Public Records
Mortgage History
| Date | Status | Borrower | Loan Amount |
|---|---|---|---|
| Open | Almonte Rafael G | $225,000 | |
| Previous Owner | Liriano Rafael M | $231,300 | |
| Previous Owner | Liriano Rafael M | $210,000 |
Source: Public Records
Tax History
| Year | Tax Paid | Tax Assessment Tax Assessment Total Assessment is a certain percentage of the fair market value that is determined by local assessors to be the total taxable value of land and additions on the property. | Land | Improvement |
|---|---|---|---|---|
| 2025 | $7,064 | $419,700 | $119,700 | $300,000 |
| 2024 | $6,673 | $419,700 | $119,700 | $300,000 |
| 2023 | $6,266 | $343,700 | $95,800 | $247,900 |
| 2022 | $6,211 | $343,700 | $95,800 | $247,900 |
| 2021 | $5,192 | $223,600 | $60,700 | $162,900 |
| 2020 | $4,814 | $212,900 | $60,700 | $152,200 |
| 2019 | $4,633 | $212,900 | $60,700 | $152,200 |
| 2018 | $4,516 | $212,900 | $60,700 | $152,200 |
| 2017 | $4,506 | $174,700 | $66,100 | $108,600 |
| 2016 | $4,380 | $174,700 | $66,100 | $108,600 |
| 2015 | $4,285 | $174,700 | $66,100 | $108,600 |
| 2014 | -- | $174,700 | $66,100 | $108,600 |
Source: Public Records
Map
Nearby Homes
- 19 Cross St
- 23-25 Salem St
- 32 Norton St
- 9-11 Mason St
- 46 Perham St Unit 214
- 151 Tolles St Unit 244
- 5 Merrimack St
- 11 Amory St
- 11 Charles St
- 14 Artillery Ln Unit A
- 14 Pleasant St
- 36 Courtland St Unit 38
- 18-20 Maple St
- 22 Beech St
- 70 Concord St
- 14 Mulberry St
- 16 Walden Pond Dr
- 79 Walden Pond Dr
- 13 Mulvanity St
- 79 Concord St
- 15 1/2 Cross St
- 7 Cross St Unit 13
- 21 Martin St
- 17 Martin St Unit 19
- 5 Cross St
- 14 Cross St
- 18 Cross St
- 12 Cross St
- 3 Cross St
- 1 Pearson St
- 27 Whitney St Unit 29
- 6 Cross St Unit Cross st 3
- 6 Cross St Unit Cross st 2
- 6 Pearson St
- 46 Cross St
- 4 Cross St
- 33 Whitney St
- 21 Cross St
- 4 Pearson St
- 26 Whitney St
Your Personal Tour Guide
Ask me questions while you tour the home.