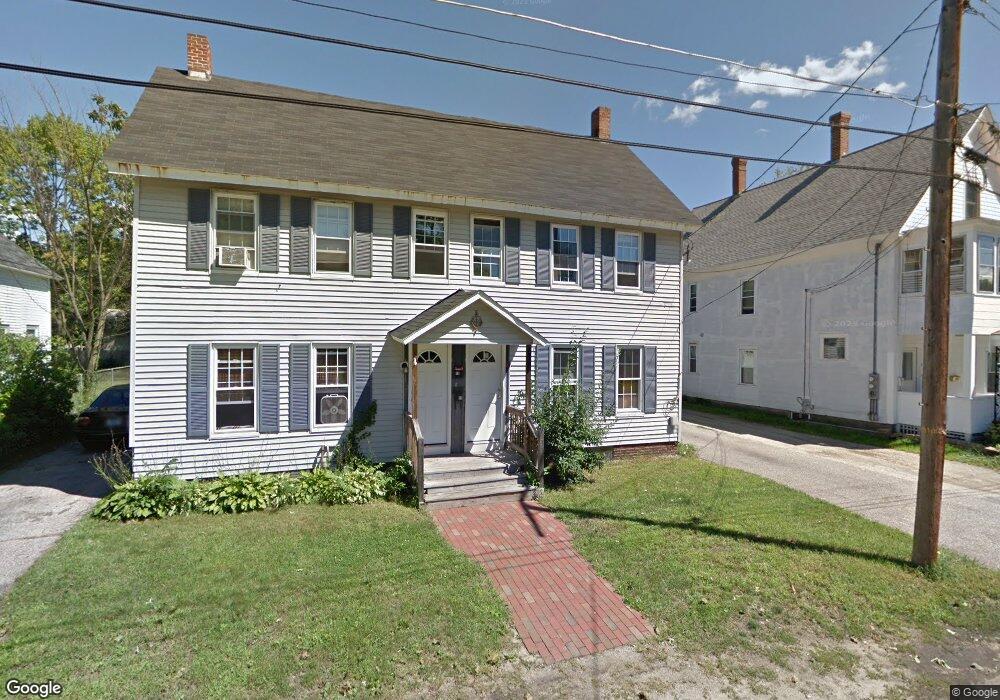
15 Dakin St Unit 17 Concord, NH 03301
South End NeighborhoodEstimated Value: $408,000 - $464,000
6
Beds
2
Baths
2,773
Sq Ft
$161/Sq Ft
Est. Value
About This Home
This home is located at 15 Dakin St Unit 17, Concord, NH 03301 and is currently estimated at $445,582, approximately $160 per square foot. 15 Dakin St Unit 17 is a home located in Merrimack County with nearby schools including Abbot-Downing School, Rundlett Middle School, and Concord High School.
Ownership History
Date
Name
Owned For
Owner Type
Purchase Details
Closed on
Nov 13, 2023
Sold by
Sally J Marr Ret By Tr and Marr
Bought by
Thibeau Patricia A
Current Estimated Value
Purchase Details
Closed on
Jul 15, 2010
Sold by
Department Of Housing & Urban Dev
Bought by
Bronson David C
Home Financials for this Owner
Home Financials are based on the most recent Mortgage that was taken out on this home.
Original Mortgage
$66,000
Interest Rate
4.82%
Mortgage Type
Purchase Money Mortgage
Purchase Details
Closed on
May 21, 2009
Sold by
Kneeland Patricia A
Bought by
Bac Home Loans Svcng L
Purchase Details
Closed on
May 23, 2000
Sold by
Gagnon Rachel E
Bought by
Kneeland Patricia A
Create a Home Valuation Report for This Property
The Home Valuation Report is an in-depth analysis detailing your home's value as well as a comparison with similar homes in the area
Home Values in the Area
Average Home Value in this Area
Purchase History
| Date | Buyer | Sale Price | Title Company |
|---|---|---|---|
| Thibeau Patricia A | $375,000 | None Available | |
| Bronson David C | $141,000 | -- | |
| Bronson David C | $141,000 | -- | |
| Bac Home Loans Svcng L | $225,800 | -- | |
| Bac Home Loans Svcng L | $225,800 | -- | |
| Kneeland Patricia A | $134,100 | -- | |
| Kneeland Patricia A | $134,100 | -- |
Source: Public Records
Mortgage History
| Date | Status | Borrower | Loan Amount |
|---|---|---|---|
| Previous Owner | Kneeland Patricia A | $60,000 | |
| Previous Owner | Kneeland Patricia A | $66,000 |
Source: Public Records
Tax History Compared to Growth
Tax History
| Year | Tax Paid | Tax Assessment Tax Assessment Total Assessment is a certain percentage of the fair market value that is determined by local assessors to be the total taxable value of land and additions on the property. | Land | Improvement |
|---|---|---|---|---|
| 2024 | $7,828 | $282,700 | $104,000 | $178,700 |
| 2023 | $7,593 | $282,700 | $104,000 | $178,700 |
| 2022 | $7,319 | $282,700 | $104,000 | $178,700 |
| 2021 | $7,101 | $282,700 | $104,000 | $178,700 |
| 2020 | $6,685 | $249,800 | $86,900 | $162,900 |
| 2019 | $6,648 | $239,300 | $85,500 | $153,800 |
| 2018 | $6,416 | $227,600 | $82,100 | $145,500 |
| 2017 | $6,351 | $224,900 | $80,700 | $144,200 |
| 2016 | $5,678 | $205,200 | $80,700 | $124,500 |
| 2015 | $5,165 | $188,900 | $73,300 | $115,600 |
| 2014 | $5,064 | $188,900 | $73,300 | $115,600 |
| 2013 | -- | $178,300 | $73,300 | $105,000 |
| 2012 | $4,694 | $192,600 | $73,300 | $119,300 |
Source: Public Records
Map
Nearby Homes
- 33 Spruce St
- 24 Badger St
- 0 Spruce St Unit 88
- 105 S Main St
- 14 Downing St
- 12 Avon St
- 122 South St
- 14-16 Perley St
- 75 S State St
- 47 South St
- 10 Perley St
- 87 S Main St Unit 2
- 0 South St Unit 4969509
- 4 Fayette St
- 54 Pleasant St Unit 8
- 15 Wilson Ave
- 22 Wilson Ave
- 376 S Main St
- 22 Longmeadow Dr
- 41 Longmeadow Dr