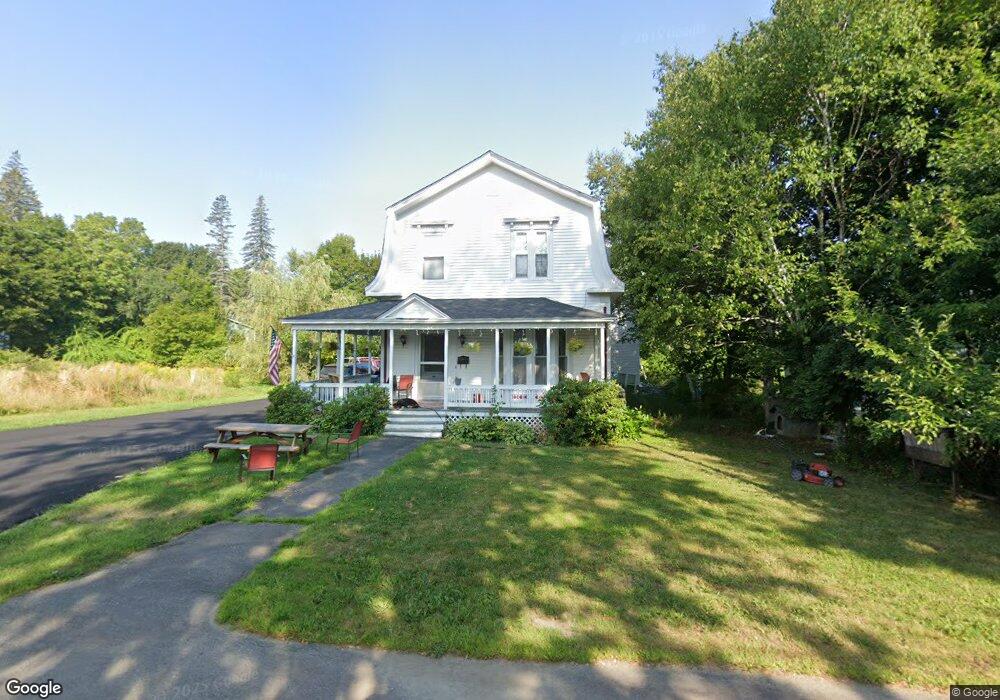
15 Downes St Calais, ME 04619
Estimated Value: $201,799 - $285,000
5
Beds
3
Baths
2,290
Sq Ft
$104/Sq Ft
Est. Value
About This Home
This home is located at 15 Downes St, Calais, ME 04619 and is currently estimated at $238,950, approximately $104 per square foot. 15 Downes St is a home located in Washington County with nearby schools including Calais Elementary School and Calais Middle/High School.
Ownership History
Date
Name
Owned For
Owner Type
Purchase Details
Closed on
Sep 30, 2011
Sold by
Hatch Christopher and Hatch Amanda
Bought by
Travis Donna D and Travis William J
Current Estimated Value
Purchase Details
Closed on
Feb 13, 2007
Sold by
Thompson Humle H
Bought by
Burns Robert E and Burns Lorna M
Home Financials for this Owner
Home Financials are based on the most recent Mortgage that was taken out on this home.
Original Mortgage
$105,300
Interest Rate
7%
Mortgage Type
Commercial
Create a Home Valuation Report for This Property
The Home Valuation Report is an in-depth analysis detailing your home's value as well as a comparison with similar homes in the area
Home Values in the Area
Average Home Value in this Area
Purchase History
| Date | Buyer | Sale Price | Title Company |
|---|---|---|---|
| Travis Donna D | -- | -- | |
| Burns Robert E | -- | -- |
Source: Public Records
Mortgage History
| Date | Status | Borrower | Loan Amount |
|---|---|---|---|
| Previous Owner | Burns Robert E | $105,300 |
Source: Public Records
Tax History
| Year | Tax Paid | Tax Assessment Tax Assessment Total Assessment is a certain percentage of the fair market value that is determined by local assessors to be the total taxable value of land and additions on the property. | Land | Improvement |
|---|---|---|---|---|
| 2024 | $2,639 | $175,900 | $28,800 | $147,100 |
| 2023 | $2,581 | $151,800 | $24,900 | $126,900 |
| 2022 | $2,329 | $122,600 | $20,100 | $102,500 |
| 2021 | $2,540 | $117,600 | $19,300 | $98,300 |
| 2020 | $2,543 | $100,500 | $16,500 | $84,000 |
| 2019 | $2,543 | $100,500 | $16,500 | $84,000 |
| 2018 | $2,543 | $100,500 | $16,500 | $84,000 |
| 2017 | $2,543 | $100,500 | $16,500 | $84,000 |
| 2016 | $2,543 | $100,500 | $16,500 | $84,000 |
| 2015 | $2,543 | $100,500 | $16,500 | $84,000 |
| 2014 | $2,543 | $100,500 | $16,500 | $84,000 |
| 2013 | -- | $100,500 | $16,500 | $84,000 |
Source: Public Records
Map
Nearby Homes
Your Personal Tour Guide
Ask me questions while you tour the home.