15 Duncan Ave Auburn, MA 01501
Stoneville NeighborhoodEstimated Value: $455,000 - $536,000
3
Beds
2
Baths
1,687
Sq Ft
$288/Sq Ft
Est. Value
About This Home
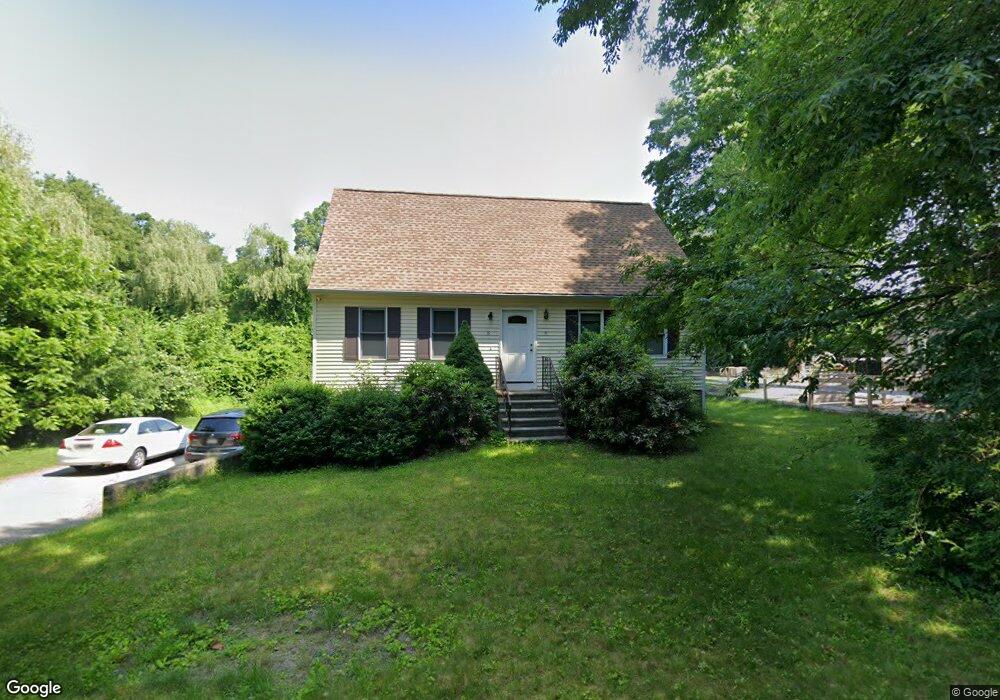
This home is located at 15 Duncan Ave, Auburn, MA 01501 and is currently estimated at $486,501, approximately $288 per square foot. 15 Duncan Ave is a home located in Worcester County with nearby schools including Auburn Senior High School, Canterbury Street School, and Shrewsbury Montessori School - Auburn Campus.
Ownership History
Date
Name
Owned For
Owner Type
Purchase Details
Closed on
Dec 8, 2008
Sold by
Devine 4Th John W and Devine Kathleen
Bought by
Owusu Kofi M
Current Estimated Value
Home Financials for this Owner
Home Financials are based on the most recent Mortgage that was taken out on this home.
Original Mortgage
$176,000
Outstanding Balance
$116,178
Interest Rate
6.11%
Mortgage Type
Purchase Money Mortgage
Estimated Equity
$370,323
Create a Home Valuation Report for This Property
The Home Valuation Report is an in-depth analysis detailing your home's value as well as a comparison with similar homes in the area
Home Values in the Area
Average Home Value in this Area
Purchase History
| Date | Buyer | Sale Price | Title Company |
|---|---|---|---|
| Owusu Kofi M | $220,000 | -- |
Source: Public Records
Mortgage History
| Date | Status | Borrower | Loan Amount |
|---|---|---|---|
| Open | Owusu Kofi M | $176,000 |
Source: Public Records
Tax History
| Year | Tax Paid | Tax Assessment Tax Assessment Total Assessment is a certain percentage of the fair market value that is determined by local assessors to be the total taxable value of land and additions on the property. | Land | Improvement |
|---|---|---|---|---|
| 2025 | $54 | $377,300 | $127,200 | $250,100 |
| 2024 | $5,544 | $371,300 | $121,600 | $249,700 |
| 2023 | $5,450 | $343,200 | $110,500 | $232,700 |
| 2022 | $5,088 | $302,500 | $110,500 | $192,000 |
| 2021 | $4,733 | $260,900 | $97,600 | $163,300 |
| 2020 | $4,576 | $254,500 | $97,600 | $156,900 |
| 2019 | $4,627 | $251,200 | $96,600 | $154,600 |
| 2018 | $4,383 | $237,700 | $90,400 | $147,300 |
| 2017 | $4,110 | $224,100 | $82,000 | $142,100 |
| 2016 | $4,027 | $222,600 | $85,400 | $137,200 |
| 2015 | $3,808 | $220,600 | $85,400 | $135,200 |
| 2014 | $3,750 | $216,900 | $81,300 | $135,600 |
Source: Public Records
Map
Nearby Homes
- 99 Clover St
- 177 Boyce St
- 191 Boyce St
- 5 Commonwealth Ave
- 22 Lanark St
- 25 Vinal St Unit 26
- 25 Vinal St Unit 29
- 25 Vinal St Unit 30
- 35 Genessee St Unit E
- 27 Havana Rd
- 177 Oxford St N
- 315 Stafford St
- 19-20 Williams St
- 26 Sylvan St
- 31-33 Walsh Ave
- 33 Walsh Ave
- 31 Walsh Ave
- 1-9 Helens Way
- 13 Merchant St
- 2 Montague St
Your Personal Tour Guide
Ask me questions while you tour the home.