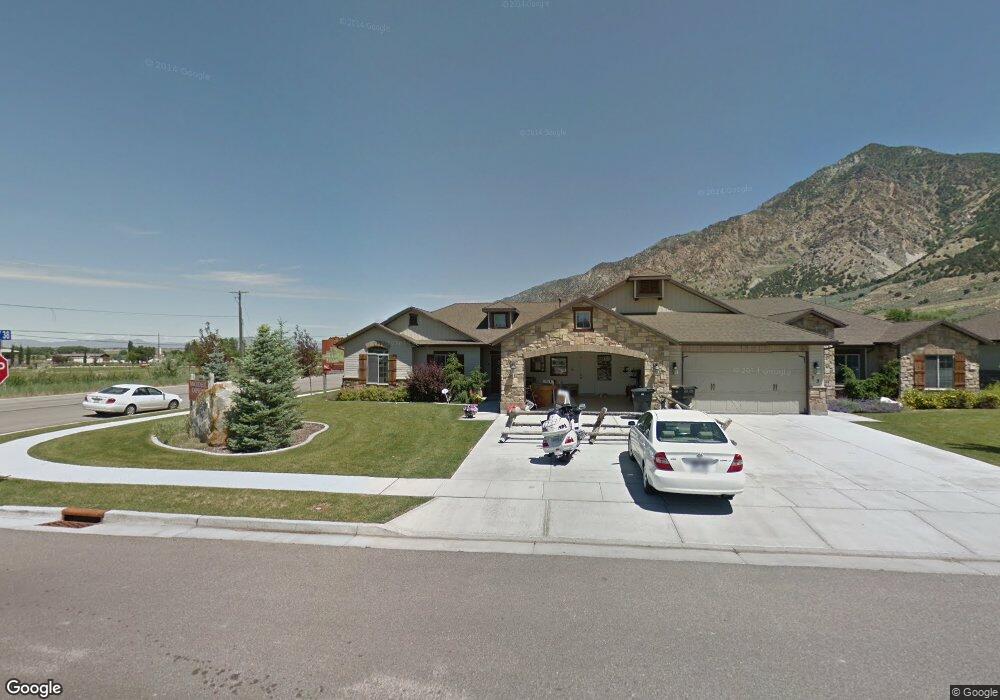
15 E 1300 N Brigham City, UT 84302
Estimated Value: $414,000 - $475,000
2
Beds
2
Baths
1,598
Sq Ft
$272/Sq Ft
Est. Value
About This Home
This home is located at 15 E 1300 N, Brigham City, UT 84302 and is currently estimated at $435,272, approximately $272 per square foot. 15 E 1300 N is a home located in Box Elder County with nearby schools including Golden Spike Elementary, Box Elder Middle School, and Adele C. Young Intermediate School.
Ownership History
Date
Name
Owned For
Owner Type
Purchase Details
Closed on
Oct 12, 2014
Sold by
Nosnikrap Apex Trust
Bought by
Vitz Gregory E
Current Estimated Value
Home Financials for this Owner
Home Financials are based on the most recent Mortgage that was taken out on this home.
Original Mortgage
$168,000
Outstanding Balance
$128,796
Interest Rate
4.1%
Mortgage Type
New Conventional
Estimated Equity
$306,476
Purchase Details
Closed on
Oct 10, 2014
Sold by
Vitz Gregory E
Bought by
Vitz Gregory E and Vitz Mickl C
Home Financials for this Owner
Home Financials are based on the most recent Mortgage that was taken out on this home.
Original Mortgage
$168,000
Outstanding Balance
$128,796
Interest Rate
4.1%
Mortgage Type
New Conventional
Estimated Equity
$306,476
Purchase Details
Closed on
Sep 2, 2009
Sold by
Kotter Canyon Estates Llc
Bought by
Nosnikrap Apex Trust
Create a Home Valuation Report for This Property
The Home Valuation Report is an in-depth analysis detailing your home's value as well as a comparison with similar homes in the area
Purchase History
| Date | Buyer | Sale Price | Title Company |
|---|---|---|---|
| Vitz Gregory E | -- | Eagle Gate Title Insurance A | |
| Vitz Gregory E | -- | None Available | |
| Nosnikrap Apex Trust | -- | -- |
Source: Public Records
Mortgage History
| Date | Status | Borrower | Loan Amount |
|---|---|---|---|
| Open | Vitz Gregory E | $168,000 |
Source: Public Records
Tax History
| Year | Tax Paid | Tax Assessment Tax Assessment Total Assessment is a certain percentage of the fair market value that is determined by local assessors to be the total taxable value of land and additions on the property. | Land | Improvement |
|---|---|---|---|---|
| 2025 | $2,381 | $409,425 | $100,000 | $309,425 |
| 2024 | $2,147 | $413,398 | $95,000 | $318,398 |
| 2023 | $2,099 | $413,792 | $80,000 | $333,792 |
| 2022 | $2,211 | $405,251 | $37,500 | $367,751 |
| 2021 | $1,886 | $270,615 | $37,500 | $233,115 |
| 2020 | $1,666 | $270,615 | $37,500 | $233,115 |
| 2019 | $1,551 | $20,625 | $20,625 | $0 |
| 2018 | $1,388 | $119,288 | $20,625 | $98,663 |
| 2017 | $1,328 | $197,598 | $16,500 | $167,598 |
| 2016 | $1,386 | $104,290 | $16,500 | $87,790 |
| 2015 | $1,276 | $96,309 | $16,500 | $79,809 |
| 2014 | $1,276 | $92,507 | $16,500 | $76,007 |
| 2013 | -- | $92,507 | $16,500 | $76,007 |
Source: Public Records
Map
Nearby Homes
- 1358 N 250 E
- 273 W 1325 N Unit 40
- 285 W 1150 N Unit Q307
- 289 W 1150 N Unit Q306
- 360 E 1300 N
- 981 N 200 W Unit U326
- 973 N 200 W Unit U328
- 2216 S 700 W
- 349 W 1400 S Unit 46
- 335 W 1150 N Unit P301
- 335 W 1150 N
- 81 W 925 N
- 327 W 1150 N
- 327 W 1150 N Unit P303
- 349 W 1400 N
- 1389 Kotter Dr Unit 47
- 392 W 1400 N
- 392 W 1400 N Unit 53
- 976 N 200 W Unit V333
- 988 N 200 W Unit V336
Your Personal Tour Guide
Ask me questions while you tour the home.