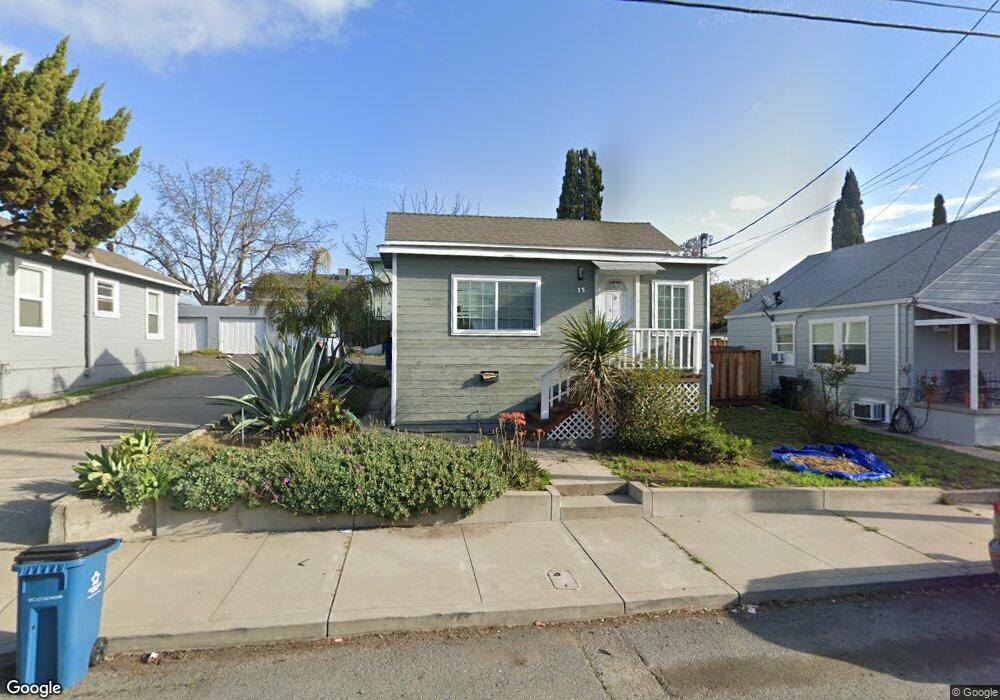
15 E 8th St Antioch, CA 94509
North Antioch NeighborhoodEstimated Value: $511,000 - $882,000
6
Beds
4
Baths
3,485
Sq Ft
$200/Sq Ft
Est. Value
About This Home
This home is located at 15 E 8th St, Antioch, CA 94509 and is currently estimated at $696,500, approximately $199 per square foot. 15 E 8th St is a home located in Contra Costa County with nearby schools including Kimball Elementary School, Antioch Middle School, and Antioch High School.
Ownership History
Date
Name
Owned For
Owner Type
Purchase Details
Closed on
Jun 30, 2023
Sold by
Macia Kenneth J
Bought by
Apple Re Holding Llc
Current Estimated Value
Home Financials for this Owner
Home Financials are based on the most recent Mortgage that was taken out on this home.
Original Mortgage
$540,000
Outstanding Balance
$524,345
Interest Rate
6.57%
Mortgage Type
New Conventional
Estimated Equity
$172,155
Purchase Details
Closed on
Jan 21, 2009
Sold by
Hsbc Bank Usa National Association
Bought by
Macia Kenneth
Purchase Details
Closed on
Mar 31, 2008
Sold by
Guthrey Edgar and Guthrey Edith
Bought by
Hsbc Bank Usa Na
Purchase Details
Closed on
Apr 9, 2004
Sold by
Bauman Sandra L and Delcolletti David G
Bought by
Guthrey Edgar and Guthrey Edith
Home Financials for this Owner
Home Financials are based on the most recent Mortgage that was taken out on this home.
Original Mortgage
$120,000
Interest Rate
6.25%
Mortgage Type
Purchase Money Mortgage
Purchase Details
Closed on
Oct 8, 1994
Sold by
Bauman Sandra L
Bought by
Bauman Sandra L and Delcolletti David G
Create a Home Valuation Report for This Property
The Home Valuation Report is an in-depth analysis detailing your home's value as well as a comparison with similar homes in the area
Home Values in the Area
Average Home Value in this Area
Purchase History
| Date | Buyer | Sale Price | Title Company |
|---|---|---|---|
| Apple Re Holding Llc | $925,000 | Old Republic Title | |
| Macia Kenneth | $85,000 | First American Title Company | |
| Hsbc Bank Usa Na | $231,986 | None Available | |
| Guthrey Edgar | $150,000 | First American Title | |
| Bauman Sandra L | -- | -- |
Source: Public Records
Mortgage History
| Date | Status | Borrower | Loan Amount |
|---|---|---|---|
| Open | Apple Re Holding Llc | $540,000 | |
| Previous Owner | Guthrey Edgar | $120,000 | |
| Closed | Guthrey Edgar | $15,000 |
Source: Public Records
Tax History Compared to Growth
Tax History
| Year | Tax Paid | Tax Assessment Tax Assessment Total Assessment is a certain percentage of the fair market value that is determined by local assessors to be the total taxable value of land and additions on the property. | Land | Improvement |
|---|---|---|---|---|
| 2025 | $4,925 | $341,700 | $265,200 | $76,500 |
| 2024 | $4,773 | $335,000 | $260,000 | $75,000 |
| 2023 | $2,146 | $105,193 | $43,313 | $61,880 |
| 2022 | $2,125 | $103,131 | $42,464 | $60,667 |
| 2021 | $2,041 | $101,110 | $41,632 | $59,478 |
| 2019 | $1,959 | $98,114 | $40,399 | $57,715 |
| 2018 | $1,887 | $96,191 | $39,607 | $56,584 |
| 2017 | $1,822 | $94,306 | $38,831 | $55,475 |
| 2016 | $1,751 | $92,458 | $38,070 | $54,388 |
| 2015 | $1,707 | $91,071 | $37,499 | $53,572 |
| 2014 | $1,642 | $89,288 | $36,765 | $52,523 |
Source: Public Records
Map
Nearby Homes