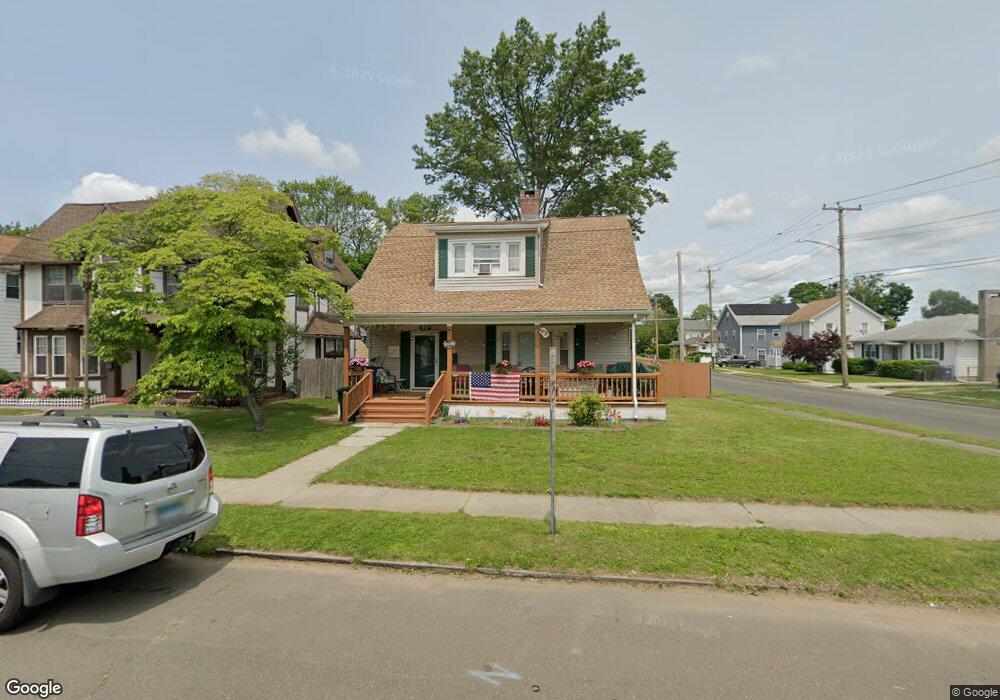
15 E Brown St West Haven, CT 06516
West Haven Center NeighborhoodEstimated Value: $274,000 - $393,000
3
Beds
2
Baths
1,633
Sq Ft
$216/Sq Ft
Est. Value
About This Home
This home is located at 15 E Brown St, West Haven, CT 06516 and is currently estimated at $353,057, approximately $216 per square foot. 15 E Brown St is a home located in New Haven County with nearby schools including Carrigan 5/6 Intermediate School, Harry M. Bailey Middle School, and West Haven High School.
Ownership History
Date
Name
Owned For
Owner Type
Purchase Details
Closed on
Sep 27, 1999
Sold by
Department Of Housing & Urban Dev
Bought by
Miraldi Gary A
Current Estimated Value
Home Financials for this Owner
Home Financials are based on the most recent Mortgage that was taken out on this home.
Original Mortgage
$56,890
Outstanding Balance
$17,532
Interest Rate
8.1%
Mortgage Type
Purchase Money Mortgage
Estimated Equity
$335,525
Purchase Details
Closed on
Apr 30, 1993
Sold by
Olsen Thure E Est and Bragaw
Bought by
Cangiano Luigi and Cangiano Gina
Home Financials for this Owner
Home Financials are based on the most recent Mortgage that was taken out on this home.
Original Mortgage
$105,200
Interest Rate
7.51%
Mortgage Type
Purchase Money Mortgage
Create a Home Valuation Report for This Property
The Home Valuation Report is an in-depth analysis detailing your home's value as well as a comparison with similar homes in the area
Home Values in the Area
Average Home Value in this Area
Purchase History
We collect this data history from publicly available records. To have your information removed, we recommend requesting removal directly through your county’s website.
| Date | Buyer | Sale Price | Title Company |
|---|---|---|---|
| Miraldi Gary A | $71,113 | -- | |
| Cangiano Luigi | $105,000 | -- | |
| Miraldi Gary A | $71,113 | -- | |
| Cangiano Luigi | $105,000 | -- |
Source: Public Records
Mortgage History
We collect this data history from publicly available records. To have your information removed, we recommend requesting removal directly through your county’s website.
| Date | Status | Borrower | Loan Amount |
|---|---|---|---|
| Open | Cangiano Luigi | $56,890 | |
| Closed | Cangiano Luigi | $56,890 | |
| Previous Owner | Cangiano Luigi | $105,200 |
Source: Public Records
Tax History
| Year | Tax Paid | Tax Assessment Tax Assessment Total Assessment is a certain percentage of the fair market value that is determined by local assessors to be the total taxable value of land and additions on the property. | Land | Improvement |
|---|---|---|---|---|
| 2025 | $7,960 | $230,510 | $71,190 | $159,320 |
| 2024 | $7,238 | $149,170 | $49,280 | $99,890 |
| 2023 | $6,938 | $149,170 | $49,280 | $99,890 |
| 2022 | $6,802 | $149,170 | $49,280 | $99,890 |
| 2021 | $6,802 | $149,170 | $49,280 | $99,890 |
| 2020 | $6,695 | $132,650 | $45,080 | $87,570 |
| 2019 | $6,456 | $132,650 | $45,080 | $87,570 |
| 2018 | $6,013 | $132,650 | $45,080 | $87,570 |
| 2017 | $6,057 | $132,650 | $45,080 | $87,570 |
| 2016 | $6,044 | $132,650 | $45,080 | $87,570 |
| 2015 | $5,929 | $146,930 | $49,910 | $97,020 |
| 2014 | $5,892 | $146,930 | $49,910 | $97,020 |
Source: Public Records
Map
Nearby Homes
Your Personal Tour Guide
Ask me questions while you tour the home.