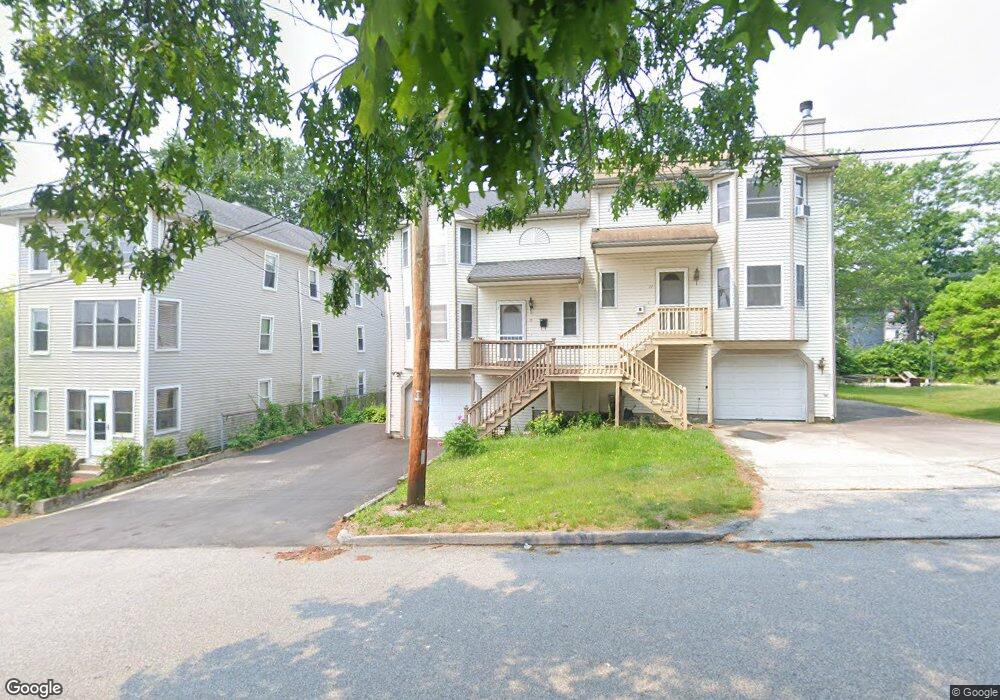
15 Eastham St Worcester, MA 01604
Hamilton NeighborhoodEstimated Value: $396,000 - $427,000
3
Beds
2
Baths
1,432
Sq Ft
$291/Sq Ft
Est. Value
About This Home
This home is located at 15 Eastham St, Worcester, MA 01604 and is currently estimated at $417,392, approximately $291 per square foot. 15 Eastham St is a home located in Worcester County with nearby schools including Jacob Hiatt Magnet School, Chandler Magnet, and Lake View Elementary School.
Ownership History
Date
Name
Owned For
Owner Type
Purchase Details
Closed on
May 26, 2006
Sold by
Oleinik Rimma and Oleinik Slava
Bought by
Jette Lisa and Jette Robert G
Current Estimated Value
Home Financials for this Owner
Home Financials are based on the most recent Mortgage that was taken out on this home.
Original Mortgage
$192,000
Interest Rate
6.53%
Mortgage Type
Purchase Money Mortgage
Purchase Details
Closed on
Mar 16, 2004
Sold by
Oleinik Slava
Bought by
Oleinik Rimma and Oleinik Slava
Home Financials for this Owner
Home Financials are based on the most recent Mortgage that was taken out on this home.
Original Mortgage
$167,500
Interest Rate
5.67%
Mortgage Type
Purchase Money Mortgage
Purchase Details
Closed on
Jun 29, 2001
Sold by
Grimaldi Frances
Bought by
Oleinik Slava
Home Financials for this Owner
Home Financials are based on the most recent Mortgage that was taken out on this home.
Original Mortgage
$150,143
Interest Rate
7.14%
Mortgage Type
Purchase Money Mortgage
Create a Home Valuation Report for This Property
The Home Valuation Report is an in-depth analysis detailing your home's value as well as a comparison with similar homes in the area
Home Values in the Area
Average Home Value in this Area
Purchase History
| Date | Buyer | Sale Price | Title Company |
|---|---|---|---|
| Jette Lisa | $238,000 | -- | |
| Oleinik Rimma | -- | -- | |
| Oleinik Slava | $152,500 | -- |
Source: Public Records
Mortgage History
| Date | Status | Borrower | Loan Amount |
|---|---|---|---|
| Open | Oleinik Slava | $190,250 | |
| Closed | Jette Lisa | $192,000 | |
| Previous Owner | Oleinik Rimma | $167,500 | |
| Previous Owner | Oleinik Slava | $150,143 | |
| Previous Owner | Oleinik Slava | $95,000 |
Source: Public Records
Tax History
| Year | Tax Paid | Tax Assessment Tax Assessment Total Assessment is a certain percentage of the fair market value that is determined by local assessors to be the total taxable value of land and additions on the property. | Land | Improvement |
|---|---|---|---|---|
| 2025 | $4,909 | $372,200 | $90,400 | $281,800 |
| 2024 | $4,737 | $344,500 | $90,400 | $254,100 |
| 2023 | $4,501 | $313,900 | $78,600 | $235,300 |
| 2022 | $4,058 | $266,800 | $62,900 | $203,900 |
| 2021 | $3,829 | $235,200 | $50,300 | $184,900 |
| 2020 | $3,737 | $219,800 | $50,300 | $169,500 |
| 2019 | $3,735 | $207,500 | $45,300 | $162,200 |
| 2018 | $3,735 | $197,500 | $45,300 | $152,200 |
| 2017 | $3,533 | $183,800 | $45,300 | $138,500 |
| 2016 | $3,491 | $169,400 | $33,900 | $135,500 |
| 2015 | $3,400 | $169,400 | $33,900 | $135,500 |
| 2014 | $3,310 | $169,400 | $33,900 | $135,500 |
Source: Public Records
Map
Nearby Homes
- 360 Hamilton St
- 19 Middlesex Ave
- Lot B Crawford St
- 21 Middlesex Ave Unit 102
- 496 Hamilton St
- 80 Delmont Ave
- 155 Hamilton St Unit 4
- 143 Dorcester
- 68 Dartmouth St
- 34 Robin Rd
- 41 Modoc St
- 12 Benham St
- 103 Hamilton St
- 10 County St
- 24 Ingleside Ave
- 115 Orient St
- 143 Commonwealth Ave
- 16 Arborwood Dr
- 63 Progressive St
- 241 Lake Ave
- 17 Eastham St
- 11 Eastham St
- 19 Eastham St
- 28 Superior Rd
- 12 Superior Rd
- 30 Superior Rd
- 12 Eastham St
- 3 Eastham St
- 8 Eastham St
- 8 Superior Rd
- 32 Superior Rd
- 343 Hamilton St
- 341 Hamilton St
- 341 Hamilton St Unit B
- 345 Hamilton St
- 333 Hamilton St
- 13 Superior Rd
- 13 Superior Rd Unit 1
- 331 Hamilton St
- 11 Superior Rd
Your Personal Tour Guide
Ask me questions while you tour the home.