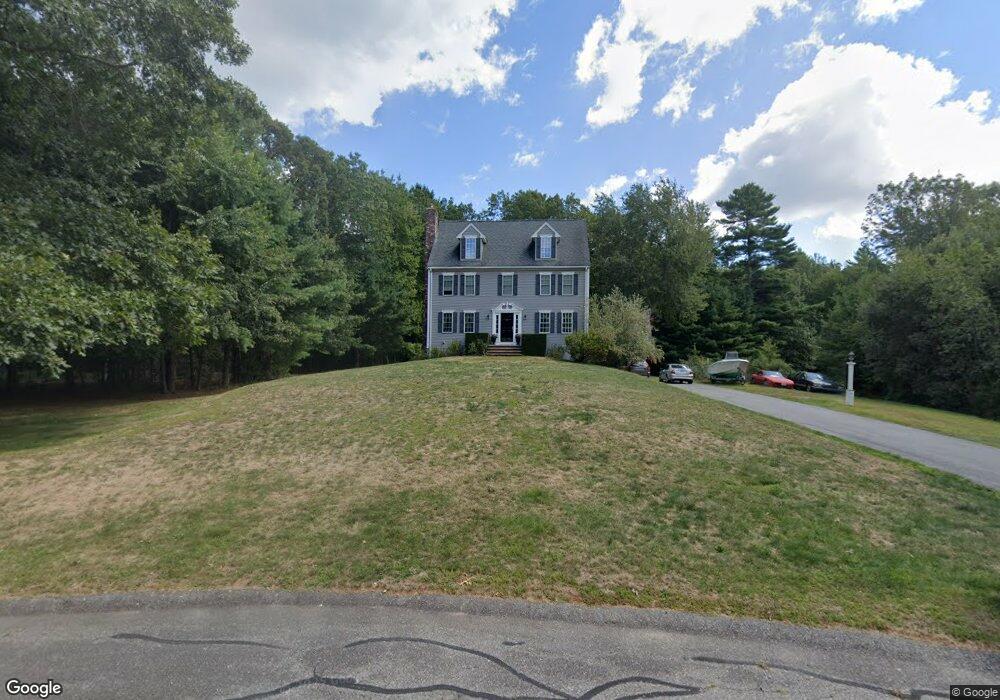
15 Edna Cir East Freetown, MA 02717
Estimated Value: $449,000
4
Beds
3
Baths
1,872
Sq Ft
$240/Sq Ft
Est. Value
About This Home
This home is located at 15 Edna Cir, East Freetown, MA 02717 and is currently priced at $449,000, approximately $239 per square foot. 15 Edna Cir is a home located in Bristol County with nearby schools including Freetown Elementary School, George R Austin Intermediate School, and Freetown-Lakeville Middle School.
Ownership History
Date
Name
Owned For
Owner Type
Purchase Details
Closed on
May 8, 2002
Sold by
Lee Jhae S
Bought by
Fahey Sean M and Fahey Michelle A
Current Estimated Value
Home Financials for this Owner
Home Financials are based on the most recent Mortgage that was taken out on this home.
Original Mortgage
$244,800
Interest Rate
7.18%
Mortgage Type
Purchase Money Mortgage
Purchase Details
Closed on
Apr 2, 1999
Sold by
Wayland Dev Corp
Bought by
Long Rlty Inc
Create a Home Valuation Report for This Property
The Home Valuation Report is an in-depth analysis detailing your home's value as well as a comparison with similar homes in the area
Home Values in the Area
Average Home Value in this Area
Purchase History
| Date | Buyer | Sale Price | Title Company |
|---|---|---|---|
| Fahey Sean M | $120,000 | -- | |
| Long Rlty Inc | $57,500 | -- |
Source: Public Records
Mortgage History
| Date | Status | Borrower | Loan Amount |
|---|---|---|---|
| Open | Long Rlty Inc | $270,000 | |
| Closed | Long Rlty Inc | $244,800 |
Source: Public Records
Tax History Compared to Growth
Tax History
| Year | Tax Paid | Tax Assessment Tax Assessment Total Assessment is a certain percentage of the fair market value that is determined by local assessors to be the total taxable value of land and additions on the property. | Land | Improvement |
|---|---|---|---|---|
| 2025 | $0 | $526,600 | $239,400 | $287,200 |
| 2024 | $5,253 | $500,400 | $225,800 | $274,600 |
| 2023 | $0 | $473,500 | $203,400 | $270,100 |
| 2022 | $5,253 | $451,000 | $172,200 | $278,800 |
| 2021 | $5,253 | $413,600 | $156,500 | $257,100 |
| 2020 | $5,228 | $401,500 | $150,400 | $251,100 |
| 2019 | $5,051 | $384,100 | $148,800 | $235,300 |
| 2018 | $4,817 | $361,900 | $148,800 | $213,100 |
| 2017 | $4,721 | $354,400 | $148,800 | $205,600 |
| 2016 | $4,536 | $346,500 | $144,500 | $202,000 |
| 2015 | $4,378 | $339,400 | $139,100 | $200,300 |
| 2014 | $4,291 | $340,300 | $141,700 | $198,600 |
Source: Public Records
Map
Nearby Homes