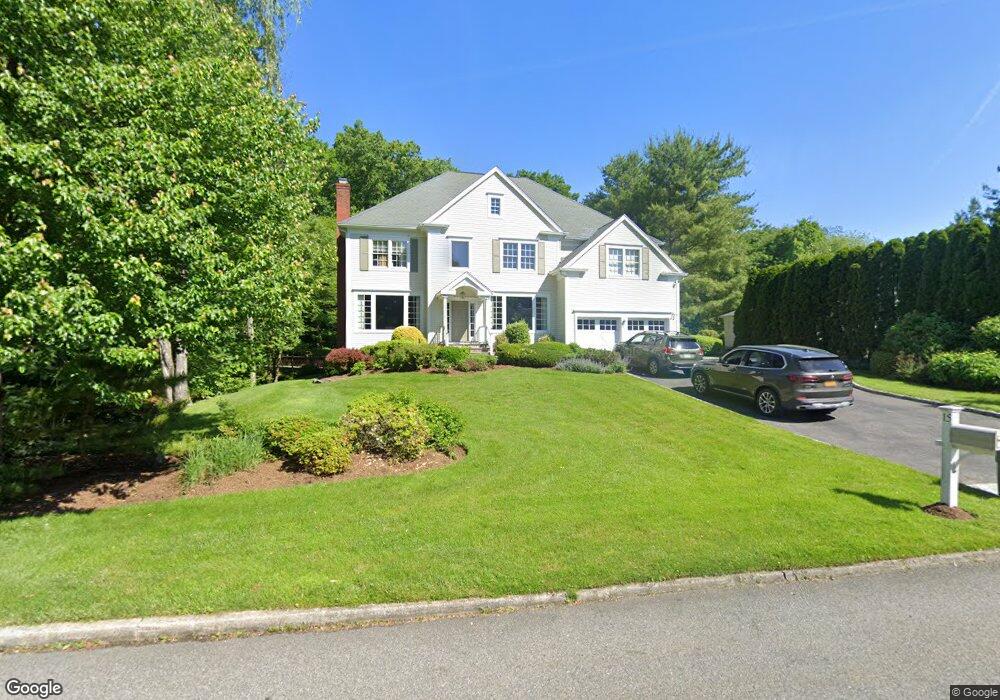
15 Fenbrook Dr Larchmont, NY 10538
Estimated Value: $2,423,000 - $2,894,000
5
Beds
5
Baths
4,018
Sq Ft
$669/Sq Ft
Est. Value
About This Home
This home is located at 15 Fenbrook Dr, Larchmont, NY 10538 and is currently estimated at $2,686,294, approximately $668 per square foot. 15 Fenbrook Dr is a home located in Westchester County with nearby schools including Mamaroneck High School, Hudson Country Montessori School, and Westchester Torah Academy.
Ownership History
Date
Name
Owned For
Owner Type
Purchase Details
Closed on
Aug 15, 2006
Sold by
Epstein Mark Elliot and Epstein Karen Schub
Bought by
Ryan Peter W and Ryan Susan
Current Estimated Value
Home Financials for this Owner
Home Financials are based on the most recent Mortgage that was taken out on this home.
Original Mortgage
$1,000,000
Outstanding Balance
$587,563
Interest Rate
6.37%
Mortgage Type
Purchase Money Mortgage
Estimated Equity
$2,098,731
Purchase Details
Closed on
Jan 24, 2003
Sold by
Reiner Alysia
Bought by
Epstein Mark Elliot and Epstein Karen Schub
Home Financials for this Owner
Home Financials are based on the most recent Mortgage that was taken out on this home.
Original Mortgage
$700,000
Interest Rate
5.91%
Mortgage Type
Purchase Money Mortgage
Create a Home Valuation Report for This Property
The Home Valuation Report is an in-depth analysis detailing your home's value as well as a comparison with similar homes in the area
Home Values in the Area
Average Home Value in this Area
Purchase History
| Date | Buyer | Sale Price | Title Company |
|---|---|---|---|
| Ryan Peter W | $1,900,000 | Chicago Title Insurance Co | |
| Epstein Mark Elliot | $1,375,000 | -- |
Source: Public Records
Mortgage History
| Date | Status | Borrower | Loan Amount |
|---|---|---|---|
| Open | Ryan Peter W | $1,000,000 | |
| Previous Owner | Epstein Mark Elliot | $700,000 |
Source: Public Records
Tax History Compared to Growth
Tax History
| Year | Tax Paid | Tax Assessment Tax Assessment Total Assessment is a certain percentage of the fair market value that is determined by local assessors to be the total taxable value of land and additions on the property. | Land | Improvement |
|---|---|---|---|---|
| 2024 | $43,475 | $2,113,000 | $664,000 | $1,449,000 |
| 2023 | $41,265 | $1,975,000 | $664,000 | $1,311,000 |
| 2022 | $39,767 | $1,812,000 | $664,000 | $1,148,000 |
| 2021 | $39,510 | $1,709,000 | $664,000 | $1,045,000 |
| 2020 | $38,975 | $1,675,000 | $664,000 | $1,011,000 |
| 2019 | $41,670 | $1,785,000 | $664,000 | $1,121,000 |
| 2018 | $42,333 | $1,850,000 | $664,000 | $1,186,000 |
| 2017 | $0 | $1,850,000 | $664,000 | $1,186,000 |
| 2016 | $43,186 | $1,850,000 | $461,000 | $1,389,000 |
| 2015 | -- | $1,949,000 | $461,000 | $1,488,000 |
| 2014 | -- | $1,900,000 | $461,000 | $1,439,000 |
| 2013 | -- | $1,900,000 | $461,000 | $1,439,000 |
Source: Public Records
Map
Nearby Homes