
Landlord's Agent in 2020
Sandi LaCasse
Jack Conway & Co Inc
(774) 271-1377
26 in this area
86 Total Sales

Estimated Value: $894,000 - $1,596,918
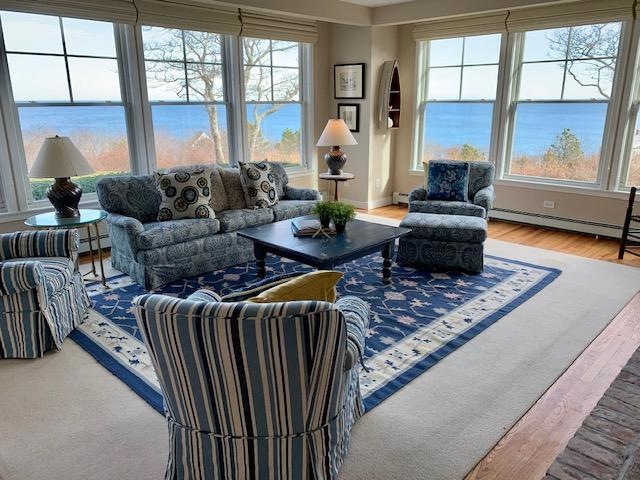
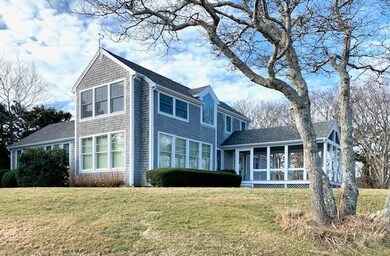
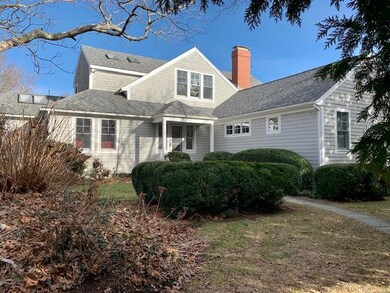
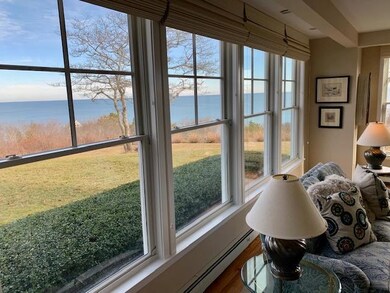
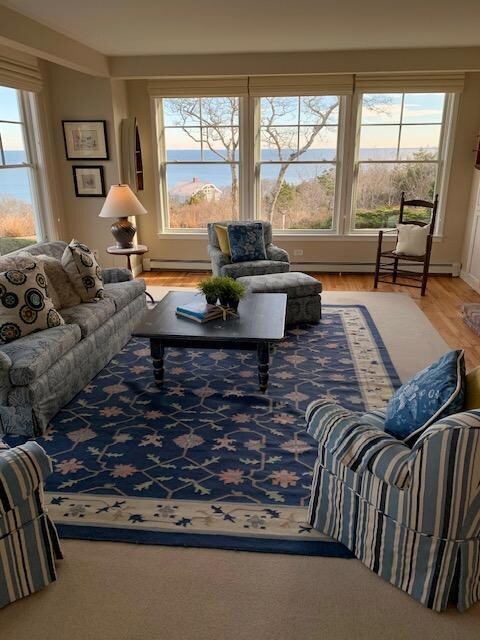
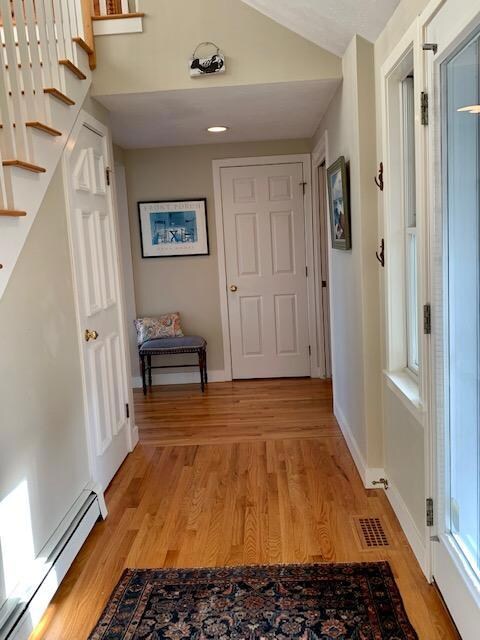
Luxury beach living. 1+ acre private lot situated high atop Sagamore Village with panoramic views of Cape Cod Bay. Enjoy the furnished open floor plan -large eat in kitchen, steps to sunken living room complete with fireplace and floor to ceiling windows boasting dramatic ocean views. Generous 23 x 11 seasonal screen porch off of kitchen. Main floor den can be used as an office, or a quiet reading nook. Also on main floor full bath and two bedrooms, one with custom bunk beds, 2nd bedroom with queen bed. Second floor Master bedroom has grandiose views of the ocean and village and master bath featuring just installed soaking tub. Supremely located on cul de sac with path access from street level to beach, close to canal for bike/walking path, neighborhood has public tennis courts/basketball and playground, and easy access to major hwys. Steep driveway- awd vehicle necessary for winter months. This is a furnished property. Landscaping included, with the exception of snow removal.
Last Agent to Rent the Property
Jack Conway & Co Inc License #9539977 Listed on: 01/08/2020
| Date | Buyer | Sale Price | Title Company |
|---|---|---|---|
| Fisher Candace L | $78,000 | -- |
| Date | Event | Price | List to Sale | Price per Sq Ft |
|---|---|---|---|---|
| 01/08/2020 01/08/20 | For Rent | $3,950 | 0.0% | -- |
| 01/08/2020 01/08/20 | Rented | $3,950 | -- | -- |
| Year | Tax Paid | Tax Assessment Tax Assessment Total Assessment is a certain percentage of the fair market value that is determined by local assessors to be the total taxable value of land and additions on the property. | Land | Improvement |
|---|---|---|---|---|
| 2025 | $11,039 | $1,413,400 | $830,300 | $583,100 |
| 2024 | $10,424 | $1,299,800 | $790,800 | $509,000 |
| 2023 | $10,183 | $1,155,900 | $699,800 | $456,100 |
| 2022 | $9,901 | $981,300 | $619,300 | $362,000 |
| 2021 | $2,717 | $893,200 | $563,500 | $329,700 |
| 2020 | $9,440 | $879,000 | $558,200 | $320,800 |
| 2019 | $9,088 | $864,700 | $558,200 | $306,500 |
| 2018 | $1,959 | $816,400 | $531,700 | $284,700 |
| 2017 | $1,818 | $811,900 | $526,700 | $285,200 |
| 2016 | $8,178 | $804,900 | $526,700 | $278,200 |
| 2015 | $8,105 | $804,900 | $526,700 | $278,200 |
Landlord's Agent in 2020
Sandi LaCasse
Jack Conway & Co Inc
(774) 271-1377
26 in this area
86 Total Sales
Source: Cape Cod & Islands Association of REALTORS®
MLS Number: 22000124
APN: BOUR-000020-000000-000006
Disclaimer: Certain information contained herein is derived from information provided by parties other than Homes.com. All information provided is deemed reliable, but is not guaranteed to be accurate and should be independently verified.
![]() All data relating to real estate for sale on this page comes from the Broker Reciprocity (BR) of the Cape Cod & Islands Multiple Listing Service, Inc. Detailed information about real estate listings held by brokerage firms other than CC&I Assoc. of REALTORS®, Inc. includes the name of the listing company. Neither the listing company nor CC&I Assoc. of REALTORS®, Inc. shall be responsible for any typographical errors, misinformation, misprints and shall be held totally harmless. The Broker providing this data believes it to be correct, but advises interested parties to confirm any item before relying on it in a purchase decision. All properties are subject to prior sale, changes, or withdrawal. Copyright 2025 © Cape Cod & Islands Multiple Listing Service, Inc. All rights reserved.
All data relating to real estate for sale on this page comes from the Broker Reciprocity (BR) of the Cape Cod & Islands Multiple Listing Service, Inc. Detailed information about real estate listings held by brokerage firms other than CC&I Assoc. of REALTORS®, Inc. includes the name of the listing company. Neither the listing company nor CC&I Assoc. of REALTORS®, Inc. shall be responsible for any typographical errors, misinformation, misprints and shall be held totally harmless. The Broker providing this data believes it to be correct, but advises interested parties to confirm any item before relying on it in a purchase decision. All properties are subject to prior sale, changes, or withdrawal. Copyright 2025 © Cape Cod & Islands Multiple Listing Service, Inc. All rights reserved.