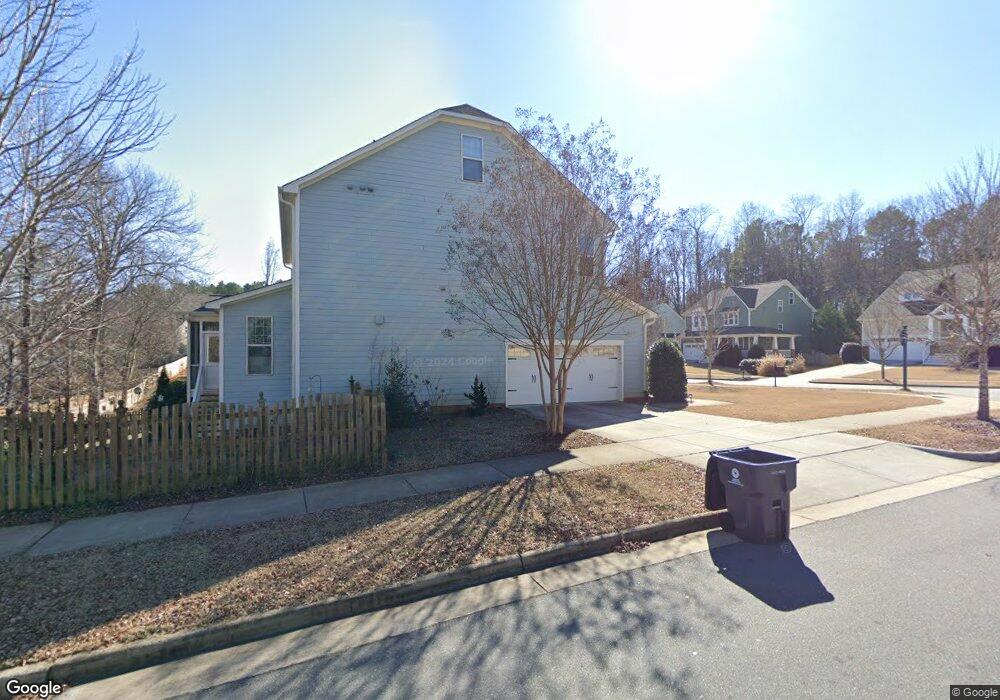
15 Freeman Dr Pittsboro, NC 27312
Estimated Value: $556,000 - $598,000
3
Beds
3
Baths
2,640
Sq Ft
$216/Sq Ft
Est. Value
About This Home
This home is located at 15 Freeman Dr, Pittsboro, NC 27312 and is currently estimated at $569,536, approximately $215 per square foot. 15 Freeman Dr is a home located in Chatham County with nearby schools including Pittsboro Elementary School, George Moses Horton Middle School, and Northwood High.
Ownership History
Date
Name
Owned For
Owner Type
Purchase Details
Closed on
Oct 16, 2020
Sold by
Larsen Lennart Joergen
Bought by
Holleman Jonathan B
Current Estimated Value
Home Financials for this Owner
Home Financials are based on the most recent Mortgage that was taken out on this home.
Original Mortgage
$308,700
Outstanding Balance
$273,443
Interest Rate
2.8%
Mortgage Type
New Conventional
Estimated Equity
$296,093
Purchase Details
Closed on
May 3, 2018
Sold by
Won Yesol and Cho Beeson H
Bought by
Larsen Lennart Joergen
Home Financials for this Owner
Home Financials are based on the most recent Mortgage that was taken out on this home.
Original Mortgage
$220,000
Interest Rate
4.45%
Mortgage Type
New Conventional
Purchase Details
Closed on
Apr 6, 2015
Sold by
Robuck Homes Triangle Llc
Bought by
Won Yesol and Cho Beeson H
Home Financials for this Owner
Home Financials are based on the most recent Mortgage that was taken out on this home.
Original Mortgage
$272,362
Interest Rate
3.84%
Mortgage Type
VA
Create a Home Valuation Report for This Property
The Home Valuation Report is an in-depth analysis detailing your home's value as well as a comparison with similar homes in the area
Home Values in the Area
Average Home Value in this Area
Purchase History
| Date | Buyer | Sale Price | Title Company |
|---|---|---|---|
| Holleman Jonathan B | $343,000 | None Available | |
| Larsen Lennart Joergen | $320,000 | None Available | |
| Won Yesol | $309,000 | None Available |
Source: Public Records
Mortgage History
| Date | Status | Borrower | Loan Amount |
|---|---|---|---|
| Open | Holleman Jonathan B | $308,700 | |
| Previous Owner | Larsen Lennart Joergen | $220,000 | |
| Previous Owner | Won Yesol | $272,362 |
Source: Public Records
Tax History Compared to Growth
Tax History
| Year | Tax Paid | Tax Assessment Tax Assessment Total Assessment is a certain percentage of the fair market value that is determined by local assessors to be the total taxable value of land and additions on the property. | Land | Improvement |
|---|---|---|---|---|
| 2025 | $5,875 | $586,362 | $69,575 | $516,787 |
| 2024 | $5,875 | $389,090 | $60,500 | $328,590 |
| 2023 | $4,244 | $389,090 | $60,500 | $328,590 |
| 2022 | $4,509 | $389,090 | $60,500 | $328,590 |
| 2021 | $4,473 | $389,090 | $60,500 | $328,590 |
| 2020 | $3,709 | $318,522 | $50,000 | $268,522 |
| 2019 | $3,699 | $318,522 | $50,000 | $268,522 |
| 2018 | $3,546 | $318,522 | $50,000 | $268,522 |
| 2017 | $3,546 | $318,522 | $50,000 | $268,522 |
| 2016 | $3,478 | $310,467 | $50,000 | $260,467 |
| 2015 | $3,441 | $310,467 | $50,000 | $260,467 |
| 2014 | $475 | $45,000 | $45,000 | $0 |
| 2013 | -- | $45,000 | $45,000 | $0 |
Source: Public Records
Map
Nearby Homes
- 73 Freeman Dr
- 26 Danbury Ct
- 115 Circle City Way
- CHANLEY Plan at Corbett Landing
- CHAMPLAIN Plan at Corbett Landing
- ELMSDALE Plan at Corbett Landing
- SEBASTIAN Plan at Corbett Landing
- DRESDEN Plan at Corbett Landing
- BALLENTINE Plan at Corbett Landing
- PARKETTE Plan at Corbett Landing
- MARABELLE Plan at Corbett Landing
- KENDALL Plan at Corbett Landing
- THEODORE Plan at Corbett Landing
- BRANFORD Plan at Corbett Landing
- KAITLYN Plan at Corbett Landing
- 1157 Hillsboro St
- 289 Gaines Trail
- 63 Loggers
- Shelby Modern Farmhouse Plan at Corbett Landing
- Chatham Forest English Cottage Plan at Corbett Landing