15 Galleron Way Unit 4 Sparks, NV 89431
McCarran Boulevard-Probasco NeighborhoodEstimated Value: $405,932 - $424,000
3
Beds
2
Baths
1,120
Sq Ft
$369/Sq Ft
Est. Value
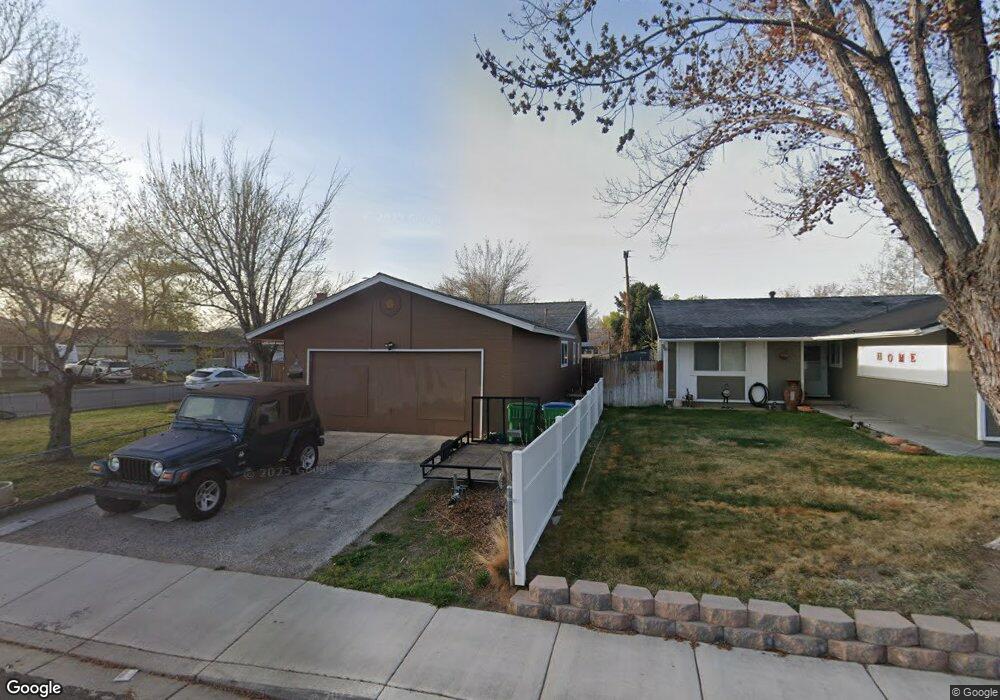
About This Home
This home is located at 15 Galleron Way Unit 4, Sparks, NV 89431 and is currently estimated at $412,983, approximately $368 per square foot. 15 Galleron Way Unit 4 is a home located in Washoe County with nearby schools including Florence Drake Elementary School, George L Dilworth Middle School, and Sparks High School.
Ownership History
Date
Name
Owned For
Owner Type
Purchase Details
Closed on
Dec 13, 2010
Sold by
Robinson Steven R and Schaffner Kate R
Bought by
Vasquez Melanie J
Current Estimated Value
Home Financials for this Owner
Home Financials are based on the most recent Mortgage that was taken out on this home.
Original Mortgage
$96,598
Outstanding Balance
$63,690
Interest Rate
4.18%
Mortgage Type
FHA
Estimated Equity
$349,293
Purchase Details
Closed on
Sep 22, 2010
Sold by
Anzelmo Randy
Bought by
Robinson Steven R and Schaffner Kate R
Purchase Details
Closed on
Jul 17, 2008
Sold by
Anzelmo Randy
Bought by
Anzelmo Randy
Home Financials for this Owner
Home Financials are based on the most recent Mortgage that was taken out on this home.
Original Mortgage
$90,000
Interest Rate
6.32%
Mortgage Type
Stand Alone Refi Refinance Of Original Loan
Create a Home Valuation Report for This Property
The Home Valuation Report is an in-depth analysis detailing your home's value as well as a comparison with similar homes in the area
Home Values in the Area
Average Home Value in this Area
Purchase History
| Date | Buyer | Sale Price | Title Company |
|---|---|---|---|
| Vasquez Melanie J | $98,000 | Commerce Title & Closing Ser | |
| Robinson Steven R | $81,608 | First American National Defa | |
| Anzelmo Randy | -- | None Available |
Source: Public Records
Mortgage History
| Date | Status | Borrower | Loan Amount |
|---|---|---|---|
| Open | Vasquez Melanie J | $96,598 | |
| Previous Owner | Anzelmo Randy | $90,000 |
Source: Public Records
Tax History Compared to Growth
Tax History
| Year | Tax Paid | Tax Assessment Tax Assessment Total Assessment is a certain percentage of the fair market value that is determined by local assessors to be the total taxable value of land and additions on the property. | Land | Improvement |
|---|---|---|---|---|
| 2025 | $780 | $51,770 | $33,565 | $18,205 |
| 2024 | $780 | $48,041 | $30,065 | $17,976 |
| 2023 | $548 | $47,940 | $31,325 | $16,615 |
| 2022 | $737 | $39,682 | $26,180 | $13,502 |
| 2021 | $715 | $31,154 | $17,955 | $13,199 |
| 2020 | $693 | $29,897 | $16,940 | $12,957 |
| 2019 | $673 | $28,157 | $15,890 | $12,267 |
| 2018 | $654 | $23,492 | $11,725 | $11,767 |
| 2017 | $635 | $21,954 | $10,395 | $11,559 |
| 2016 | $620 | $20,875 | $9,345 | $11,530 |
| 2015 | $618 | $19,026 | $7,700 | $11,326 |
| 2014 | $601 | $17,822 | $6,440 | $11,382 |
| 2013 | -- | $15,976 | $4,270 | $11,706 |
Source: Public Records
Map
Nearby Homes
- 119 Devere Way
- 10 Sheridan Way
- 213 Sawyer Way
- 120 E Lenwood Dr
- 2865 Patrice Dr
- 465 Lenwood Dr
- 1940 4th St Unit 51
- 1940 4th St Unit 20
- 3215 Delna Dr
- 377 Granada Dr
- 383 E Emerson Way
- 1945 4th St Unit 32
- 1945 4th St Unit 10
- 3104 Sandy St
- 780 Emerson Way
- 3221 Edna Ct
- 3425 Nowlin Ln
- 3311 Sprout Way
- 707 Glen Meadow Dr
- 3167 Bristle Branch Dr
- 35 Galleron Way Unit 4
- 55 Galleron Way
- 30 Galleron Way
- 10 Galleron Way
- 75 Galleron Way
- 50 Galleron Way Unit 4
- 10 Mcgoldrick Way
- 30 Mcgoldrick Way
- 2690 Courtland Way
- 2650 Courtland Way
- 50 Mcgoldrick Way
- 2700 Courtland Way
- 70 Galleron Way
- 2600 Courtland Way Unit 1A
- 85 Galleron Way
- 70 Mcgoldrick Way
- 2730 Courtland Way
- 80 Galleron Way
- 2590 Courtland Way
- 35 Devere Way