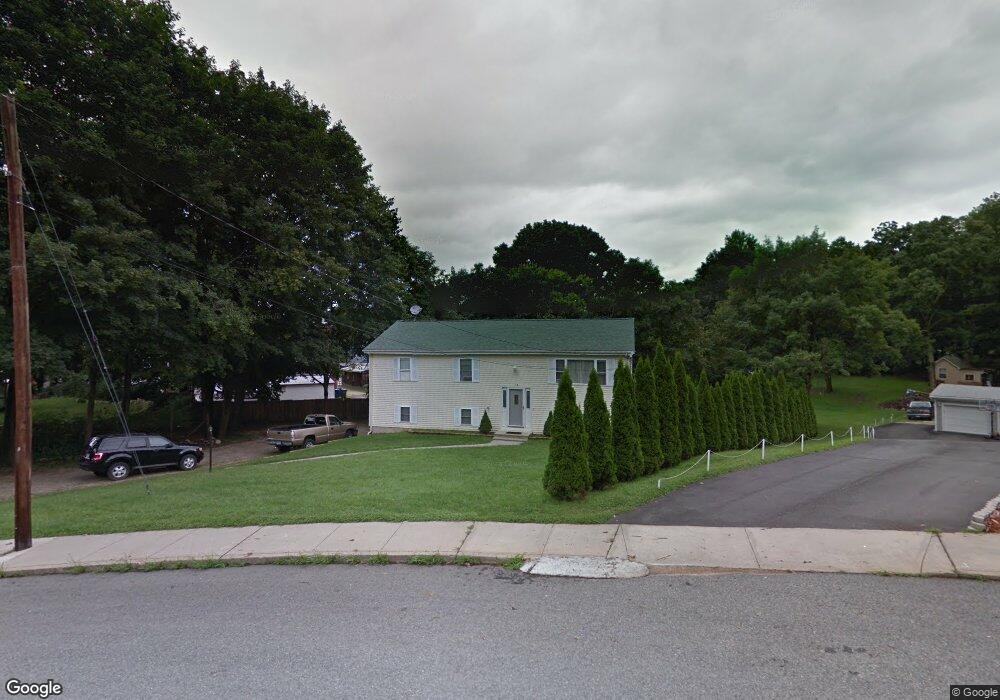
15 Gifford Ave Willimantic, CT 06226
Estimated Value: $281,000 - $319,494
3
Beds
2
Baths
1,248
Sq Ft
$238/Sq Ft
Est. Value
About This Home
This home is located at 15 Gifford Ave, Willimantic, CT 06226 and is currently estimated at $297,624, approximately $238 per square foot. 15 Gifford Ave is a home located in Windham County with nearby schools including Windham High School, St Mary St Joseph School, and Oak Grove Montessori School.
Ownership History
Date
Name
Owned For
Owner Type
Purchase Details
Closed on
Mar 17, 2003
Sold by
Norwest Bk Minnesota
Bought by
Torres Alberto
Current Estimated Value
Home Financials for this Owner
Home Financials are based on the most recent Mortgage that was taken out on this home.
Original Mortgage
$110,600
Interest Rate
5.94%
Mortgage Type
Purchase Money Mortgage
Purchase Details
Closed on
Mar 1, 1999
Sold by
Lipton Kimberly
Bought by
Macha Alphonse
Create a Home Valuation Report for This Property
The Home Valuation Report is an in-depth analysis detailing your home's value as well as a comparison with similar homes in the area
Home Values in the Area
Average Home Value in this Area
Purchase History
| Date | Buyer | Sale Price | Title Company |
|---|---|---|---|
| Torres Alberto | $110,000 | -- | |
| Macha Alphonse | $119,000 | -- |
Source: Public Records
Mortgage History
| Date | Status | Borrower | Loan Amount |
|---|---|---|---|
| Open | Macha Alphonse | $107,000 | |
| Closed | Macha Alphonse | $110,600 | |
| Closed | Macha Alphonse | $8,000 | |
| Closed | Macha Alphonse | $25,000 |
Source: Public Records
Tax History Compared to Growth
Tax History
| Year | Tax Paid | Tax Assessment Tax Assessment Total Assessment is a certain percentage of the fair market value that is determined by local assessors to be the total taxable value of land and additions on the property. | Land | Improvement |
|---|---|---|---|---|
| 2025 | $6,704 | $181,100 | $28,420 | $152,680 |
| 2024 | $6,712 | $181,100 | $28,420 | $152,680 |
| 2023 | $5,426 | $114,470 | $24,710 | $89,760 |
| 2022 | $5,346 | $114,470 | $24,710 | $89,760 |
| 2021 | $5,734 | $114,470 | $24,710 | $89,760 |
| 2020 | $5,721 | $114,470 | $24,710 | $89,760 |
| 2019 | $5,628 | $114,470 | $24,710 | $89,760 |
| 2017 | $5,153 | $108,240 | $19,540 | $88,700 |
| 2015 | $4,977 | $108,240 | $19,540 | $88,700 |
| 2014 | $4,701 | $108,240 | $19,540 | $88,700 |
Source: Public Records
Map
Nearby Homes