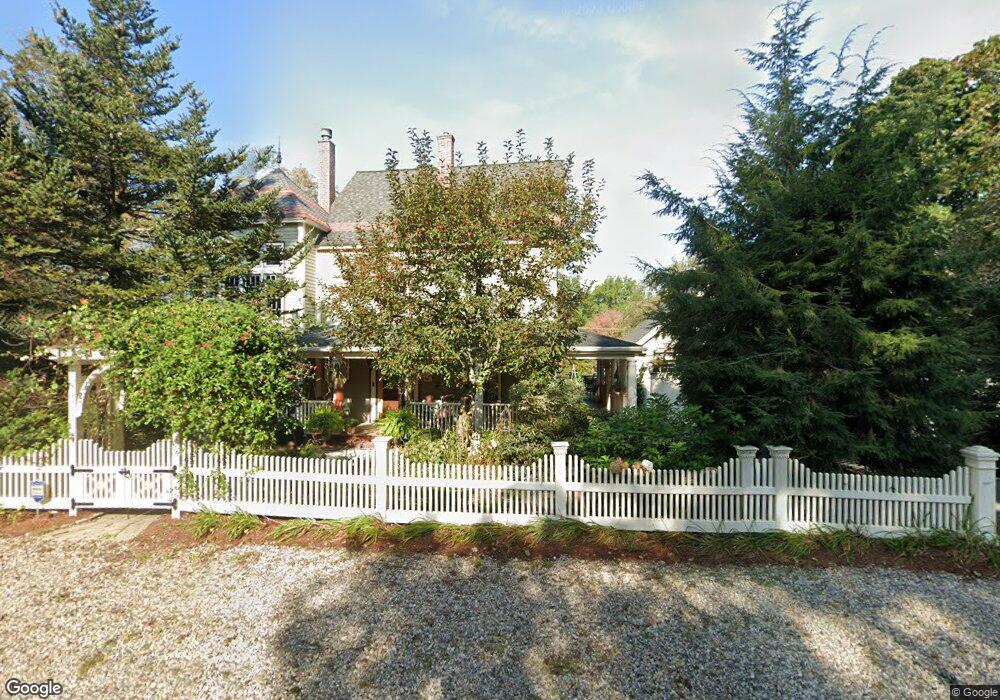
15 Glen St Natick, MA 01760
Estimated Value: $1,699,000 - $1,839,000
5
Beds
5
Baths
3,850
Sq Ft
$457/Sq Ft
Est. Value
About This Home
This home is located at 15 Glen St, Natick, MA 01760 and is currently estimated at $1,758,433, approximately $456 per square foot. 15 Glen St is a home located in Middlesex County with nearby schools including Natick High School, Memorial Elementary School, and J F Kennedy Middle School.
Ownership History
Date
Name
Owned For
Owner Type
Purchase Details
Closed on
Dec 18, 1997
Sold by
Whitney Gerald G and Whitney John T
Bought by
Wilton Kathy C
Current Estimated Value
Home Financials for this Owner
Home Financials are based on the most recent Mortgage that was taken out on this home.
Original Mortgage
$141,600
Interest Rate
7.14%
Mortgage Type
Purchase Money Mortgage
Create a Home Valuation Report for This Property
The Home Valuation Report is an in-depth analysis detailing your home's value as well as a comparison with similar homes in the area
Home Values in the Area
Average Home Value in this Area
Purchase History
| Date | Buyer | Sale Price | Title Company |
|---|---|---|---|
| Wilton Kathy C | $177,500 | -- |
Source: Public Records
Mortgage History
| Date | Status | Borrower | Loan Amount |
|---|---|---|---|
| Open | Wilton Kathy C | $238,400 | |
| Closed | Wilton Kathy C | $141,600 | |
| Closed | Wilton Kathy C | $73,000 |
Source: Public Records
Tax History Compared to Growth
Tax History
| Year | Tax Paid | Tax Assessment Tax Assessment Total Assessment is a certain percentage of the fair market value that is determined by local assessors to be the total taxable value of land and additions on the property. | Land | Improvement |
|---|---|---|---|---|
| 2025 | $17,804 | $1,488,600 | $458,600 | $1,030,000 |
| 2024 | $16,987 | $1,385,600 | $433,200 | $952,400 |
| 2023 | $15,992 | $1,265,200 | $406,900 | $858,300 |
| 2022 | $15,398 | $1,154,300 | $370,600 | $783,700 |
| 2021 | $14,570 | $1,070,500 | $350,300 | $720,200 |
| 2020 | $12,566 | $923,300 | $335,100 | $588,200 |
| 2019 | $12,750 | $923,300 | $335,100 | $588,200 |
| 2018 | $4,526 | $885,800 | $319,800 | $566,000 |
| 2017 | $11,314 | $838,700 | $283,100 | $555,600 |
| 2016 | $11,169 | $823,100 | $272,400 | $550,700 |
| 2015 | $10,690 | $773,500 | $272,400 | $501,100 |
Source: Public Records
Map
Nearby Homes
- 29 Water St
- 8 Warren Rd
- 21 Eliot St
- 91 Glen St
- 18 Phillips Pond Rd
- 104 Glen St
- 39 Davis Brook Dr
- 94 Woodland St
- 12 Winding River Cir
- 182 Winding River Rd
- 10 Sundance Way
- 60 Locust Ln
- 192 Pond Rd
- 21 Harvest Moon Dr
- 55 Ridge Hill Farm Rd
- 5 Deer Path
- 15 Penobscot Rd
- 39 Indian Ridge Rd
- 25 Yorkshire Rd
- 18 University Dr