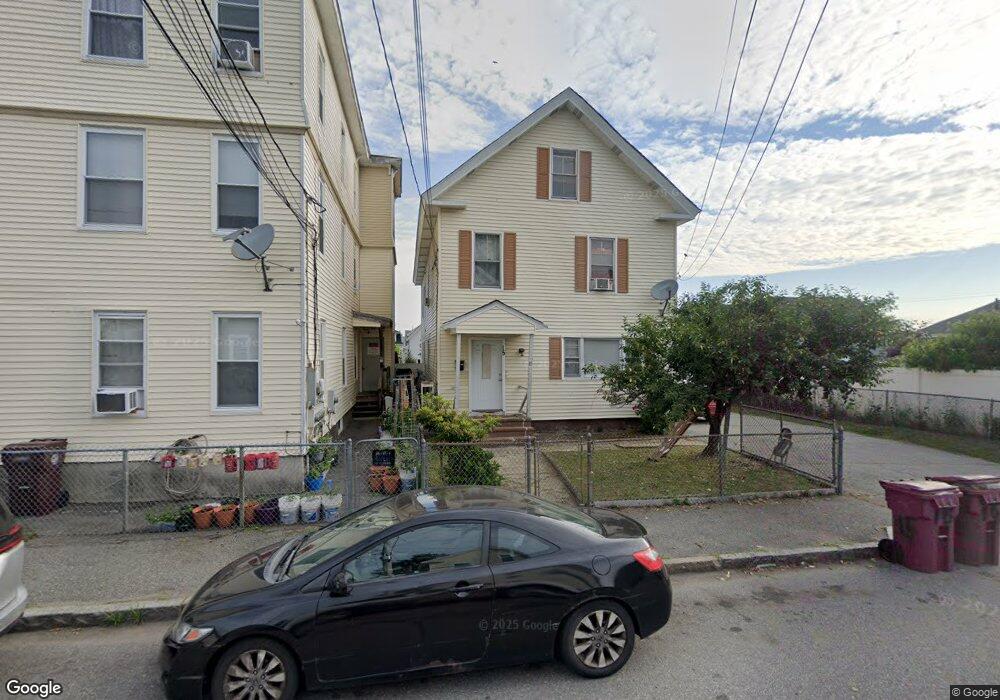
15 Grove St Lowell, MA 01851
Lower Highlands NeighborhoodEstimated Value: $538,000 - $640,193
6
Beds
2
Baths
2,736
Sq Ft
$220/Sq Ft
Est. Value
About This Home
This home is located at 15 Grove St, Lowell, MA 01851 and is currently estimated at $601,298, approximately $219 per square foot. 15 Grove St is a home located in Middlesex County with nearby schools including Charles W. Morey Elementary School, Abraham Lincoln Elementary School, and Charlotte M. Murkland Elementary School.
Ownership History
Date
Name
Owned For
Owner Type
Purchase Details
Closed on
Aug 24, 1998
Sold by
Seng Soeum and Ya Ty
Bought by
Phuong Chhoeun and Sao Ngam
Current Estimated Value
Home Financials for this Owner
Home Financials are based on the most recent Mortgage that was taken out on this home.
Original Mortgage
$125,400
Interest Rate
6.86%
Mortgage Type
Purchase Money Mortgage
Purchase Details
Closed on
Sep 1, 1995
Sold by
Fhlmc
Bought by
Seng Soeum and Seng Vicheth
Purchase Details
Closed on
Aug 31, 1995
Sold by
Taing Leang Sim and Fleet Bank Of Mass
Bought by
Fhlmc
Create a Home Valuation Report for This Property
The Home Valuation Report is an in-depth analysis detailing your home's value as well as a comparison with similar homes in the area
Home Values in the Area
Average Home Value in this Area
Purchase History
| Date | Buyer | Sale Price | Title Company |
|---|---|---|---|
| Phuong Chhoeun | $132,000 | -- | |
| Phuong Chhoeun | $132,000 | -- | |
| Seng Soeum | $43,500 | -- | |
| Seng Soeum | $43,500 | -- | |
| Fhlmc | $50,000 | -- | |
| Fhlmc | $50,000 | -- |
Source: Public Records
Mortgage History
| Date | Status | Borrower | Loan Amount |
|---|---|---|---|
| Open | Fhlmc | $92,000 | |
| Closed | Fhlmc | $125,000 | |
| Closed | Fhlmc | $125,400 |
Source: Public Records
Tax History Compared to Growth
Tax History
| Year | Tax Paid | Tax Assessment Tax Assessment Total Assessment is a certain percentage of the fair market value that is determined by local assessors to be the total taxable value of land and additions on the property. | Land | Improvement |
|---|---|---|---|---|
| 2025 | $6,847 | $596,400 | $162,600 | $433,800 |
| 2024 | $6,313 | $530,100 | $146,300 | $383,800 |
| 2023 | $5,868 | $472,500 | $127,200 | $345,300 |
| 2022 | $5,435 | $428,300 | $115,700 | $312,600 |
| 2021 | $5,043 | $374,700 | $100,600 | $274,100 |
| 2020 | $4,553 | $340,800 | $87,900 | $252,900 |
| 2019 | $4,219 | $300,500 | $81,400 | $219,100 |
| 2018 | $3,894 | $270,600 | $74,100 | $196,500 |
| 2017 | $3,685 | $247,000 | $67,400 | $179,600 |
| 2016 | $3,696 | $243,800 | $64,200 | $179,600 |
| 2015 | $3,516 | $227,100 | $65,700 | $161,400 |
| 2013 | $3,248 | $216,400 | $78,500 | $137,900 |
Source: Public Records
Map
Nearby Homes
- 21 Kimball Ave
- 42 Branch St
- 987 Middlesex St
- 173 Westford St
- 19 Lawton St
- 100 Lane St
- 45 Marshall St
- 312 Wilder St
- 27 Royal St
- 11 Columbus Ave
- 28 Grand St
- 18 Burgess St
- 23 Hillcrest Dr
- 1149 Middlesex St
- 710 School St
- 48 E St
- 118 Butterfield St
- 246 Shaw St
- 491 Dutton St Unit 320
- 491 Dutton St Unit 403