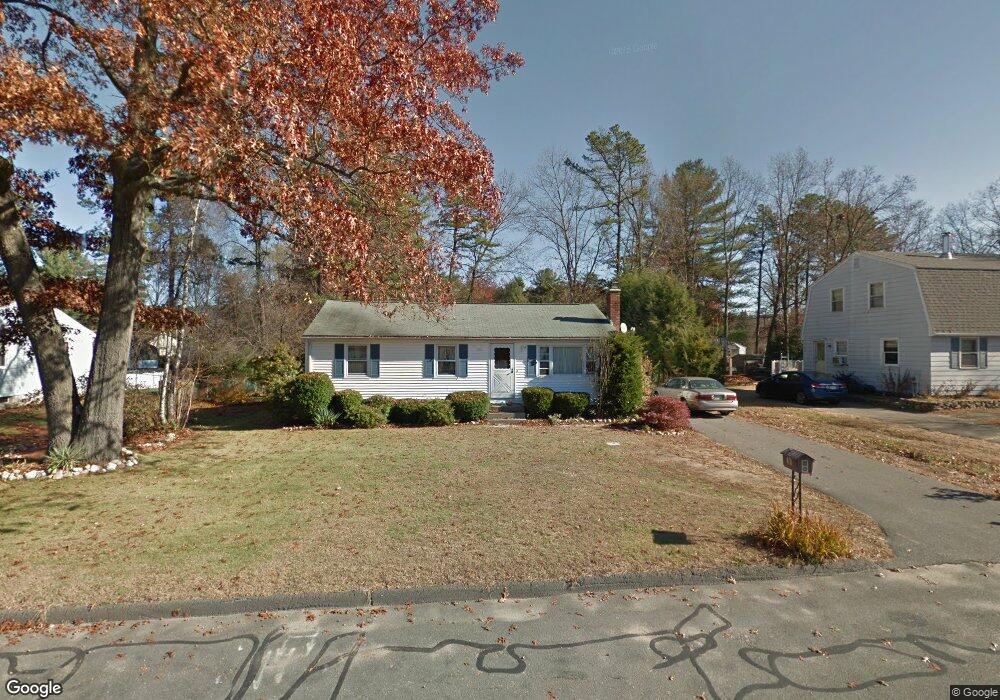
15 Gula Dr Easthampton, MA 01027
Estimated Value: $345,000 - $383,000
3
Beds
2
Baths
1,080
Sq Ft
$337/Sq Ft
Est. Value
About This Home
This home is located at 15 Gula Dr, Easthampton, MA 01027 and is currently estimated at $364,353, approximately $337 per square foot. 15 Gula Dr is a home located in Hampshire County with nearby schools including Easthampton High School, Calvary Baptist Christian School, and Tri-County Schools.
Ownership History
Date
Name
Owned For
Owner Type
Purchase Details
Closed on
Oct 30, 2008
Sold by
Hoagland Heidi C and Hoagland John L
Bought by
Kapinos James A and Kapinos Jenny T
Current Estimated Value
Home Financials for this Owner
Home Financials are based on the most recent Mortgage that was taken out on this home.
Original Mortgage
$140,000
Outstanding Balance
$90,757
Interest Rate
5.83%
Mortgage Type
Purchase Money Mortgage
Estimated Equity
$273,596
Create a Home Valuation Report for This Property
The Home Valuation Report is an in-depth analysis detailing your home's value as well as a comparison with similar homes in the area
Home Values in the Area
Average Home Value in this Area
Purchase History
| Date | Buyer | Sale Price | Title Company |
|---|---|---|---|
| Kapinos James A | $195,000 | -- |
Source: Public Records
Mortgage History
| Date | Status | Borrower | Loan Amount |
|---|---|---|---|
| Open | Kapinos James A | $140,000 |
Source: Public Records
Tax History Compared to Growth
Tax History
| Year | Tax Paid | Tax Assessment Tax Assessment Total Assessment is a certain percentage of the fair market value that is determined by local assessors to be the total taxable value of land and additions on the property. | Land | Improvement |
|---|---|---|---|---|
| 2025 | $4,105 | $300,300 | $118,300 | $182,000 |
| 2024 | $3,964 | $292,300 | $114,900 | $177,400 |
| 2023 | $3,031 | $206,900 | $90,400 | $116,500 |
| 2022 | $3,420 | $206,900 | $90,400 | $116,500 |
| 2021 | $3,733 | $212,800 | $90,400 | $122,400 |
| 2020 | $3,675 | $206,900 | $90,400 | $116,500 |
| 2019 | $3,090 | $199,900 | $90,400 | $109,500 |
| 2018 | $2,968 | $185,500 | $85,400 | $100,100 |
| 2017 | $2,897 | $178,700 | $82,100 | $96,600 |
| 2016 | $2,987 | $191,600 | $82,100 | $109,500 |
| 2015 | $2,903 | $191,600 | $82,100 | $109,500 |
Source: Public Records
Map
Nearby Homes