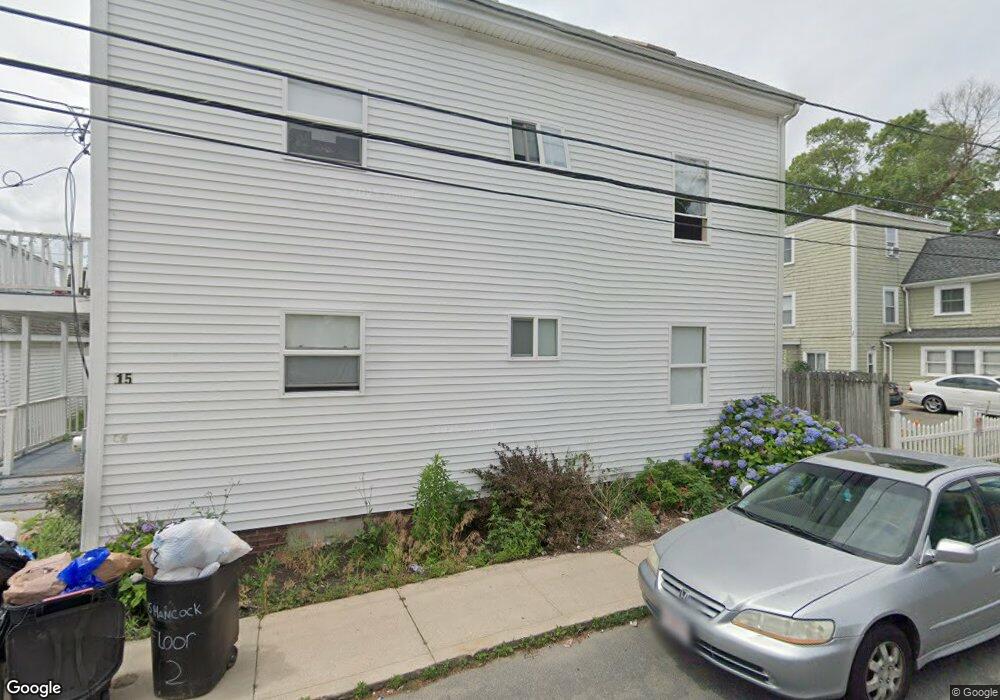
15 Hancock St Unit 1 Peabody, MA 01960
Peabody Town Center NeighborhoodEstimated Value: $680,467 - $832,000
7
Beds
2
Baths
1,980
Sq Ft
$384/Sq Ft
Est. Value
About This Home
This home is located at 15 Hancock St Unit 1, Peabody, MA 01960 and is currently estimated at $759,617, approximately $383 per square foot. 15 Hancock St Unit 1 is a home located in Essex County with nearby schools including Peabody Veterans Memorial High School, St John The Baptist School, and The Phoenix School.
Ownership History
Date
Name
Owned For
Owner Type
Purchase Details
Closed on
Nov 13, 2015
Sold by
Hantzopoulos Ft and Hantzopoulos
Bought by
Hantzopoulos Toni S
Current Estimated Value
Home Financials for this Owner
Home Financials are based on the most recent Mortgage that was taken out on this home.
Original Mortgage
$226,775
Outstanding Balance
$178,853
Interest Rate
3.87%
Mortgage Type
FHA
Estimated Equity
$580,764
Purchase Details
Closed on
Apr 22, 2013
Sold by
Hantzopoulos Peter K
Bought by
Hantzopoulos Ft and Hantzopoulos
Create a Home Valuation Report for This Property
The Home Valuation Report is an in-depth analysis detailing your home's value as well as a comparison with similar homes in the area
Home Values in the Area
Average Home Value in this Area
Purchase History
| Date | Buyer | Sale Price | Title Company |
|---|---|---|---|
| Hantzopoulos Toni S | $235,000 | -- | |
| Hantzopoulos Ft | -- | -- |
Source: Public Records
Mortgage History
| Date | Status | Borrower | Loan Amount |
|---|---|---|---|
| Open | Hantzopoulos Toni S | $226,775 |
Source: Public Records
Tax History Compared to Growth
Tax History
| Year | Tax Paid | Tax Assessment Tax Assessment Total Assessment is a certain percentage of the fair market value that is determined by local assessors to be the total taxable value of land and additions on the property. | Land | Improvement |
|---|---|---|---|---|
| 2025 | $5,473 | $591,000 | $190,900 | $400,100 |
| 2024 | $5,087 | $557,800 | $190,900 | $366,900 |
| 2023 | $4,354 | $457,400 | $166,100 | $291,300 |
| 2022 | $4,235 | $419,300 | $148,300 | $271,000 |
| 2021 | $4,272 | $407,200 | $134,800 | $272,400 |
| 2020 | $4,084 | $380,300 | $134,800 | $245,500 |
| 2019 | $3,274 | $297,400 | $134,800 | $162,600 |
| 2018 | $3,350 | $292,300 | $127,100 | $165,200 |
| 2017 | $3,537 | $300,800 | $127,100 | $173,700 |
| 2016 | $3,152 | $264,400 | $127,100 | $137,300 |
| 2015 | $2,882 | $234,300 | $127,100 | $107,200 |
Source: Public Records
Map
Nearby Homes
- 111 Foster St Unit 401
- 111 Foster St Unit 416
- 13 State St
- 9 Sutton St
- 12 Sutton St
- 46 Sutton St
- 10 Elliott Place Unit 1R
- 48 Franklin St
- 2 Osborne St
- 176 Marlborough Rd
- 159 Marlborough Rd
- 8 Walnut St Unit 209
- 8 Crowninshield St Unit 111
- 46 Walnut St
- 130 Lowell St
- 25 Outlook Ave
- 4 Elm St Unit 3
- 45 Ellsworth Rd
- 26 Elm St
- 8R Elm St Unit 2