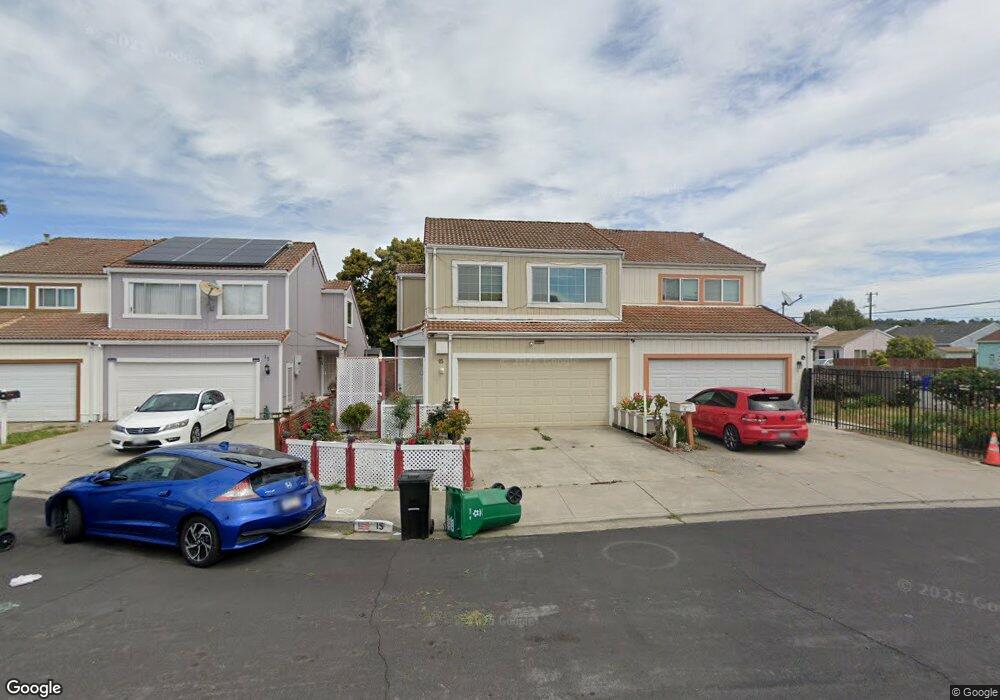
15 Haviland Ct San Pablo, CA 94806
Estimated Value: $362,265 - $526,000
2
Beds
2
Baths
1,083
Sq Ft
$393/Sq Ft
Est. Value
About This Home
This home is located at 15 Haviland Ct, San Pablo, CA 94806 and is currently estimated at $425,316, approximately $392 per square foot. 15 Haviland Ct is a home located in Contra Costa County with nearby schools including Lake Elementary School, Walter T. Helms Middle School, and Richmond High School.
Ownership History
Date
Name
Owned For
Owner Type
Purchase Details
Closed on
Mar 30, 2001
Sold by
Lara Eduardo and Lara Mario R
Bought by
Saludares Edwin Jose B and Saludares Chita Damo
Current Estimated Value
Home Financials for this Owner
Home Financials are based on the most recent Mortgage that was taken out on this home.
Original Mortgage
$148,000
Interest Rate
7.19%
Mortgage Type
Purchase Money Mortgage
Purchase Details
Closed on
Dec 23, 1993
Sold by
Patelco Credit Union
Bought by
Lara Eduardo and Lara Mario R
Home Financials for this Owner
Home Financials are based on the most recent Mortgage that was taken out on this home.
Original Mortgage
$101,970
Interest Rate
7.09%
Mortgage Type
FHA
Purchase Details
Closed on
Sep 20, 1993
Sold by
Professional Foreclosure Corp
Bought by
Patelco Credit Union
Create a Home Valuation Report for This Property
The Home Valuation Report is an in-depth analysis detailing your home's value as well as a comparison with similar homes in the area
Home Values in the Area
Average Home Value in this Area
Purchase History
| Date | Buyer | Sale Price | Title Company |
|---|---|---|---|
| Saludares Edwin Jose B | $185,000 | Commonwealth Land Title Co | |
| Lara Eduardo | $101,000 | North American Title Company | |
| Patelco Credit Union | $61,513 | Commonwealth Land Title |
Source: Public Records
Mortgage History
| Date | Status | Borrower | Loan Amount |
|---|---|---|---|
| Previous Owner | Saludares Edwin Jose B | $148,000 | |
| Previous Owner | Lara Eduardo | $101,970 |
Source: Public Records
Tax History Compared to Growth
Tax History
| Year | Tax Paid | Tax Assessment Tax Assessment Total Assessment is a certain percentage of the fair market value that is determined by local assessors to be the total taxable value of land and additions on the property. | Land | Improvement |
|---|---|---|---|---|
| 2025 | $4,730 | $278,741 | $180,809 | $97,932 |
| 2024 | $4,534 | $273,276 | $177,264 | $96,012 |
| 2023 | $4,534 | $267,919 | $173,789 | $94,130 |
| 2022 | $4,459 | $262,667 | $170,382 | $92,285 |
| 2021 | $4,423 | $257,518 | $167,042 | $90,476 |
| 2019 | $4,187 | $249,883 | $162,089 | $87,794 |
| 2018 | $4,016 | $244,984 | $158,911 | $86,073 |
| 2017 | $3,904 | $240,182 | $155,796 | $84,386 |
| 2016 | $3,832 | $235,474 | $152,742 | $82,732 |
| 2015 | $3,799 | $231,938 | $150,448 | $81,490 |
| 2014 | $3,766 | $227,395 | $147,501 | $79,894 |
Source: Public Records
Map
Nearby Homes
- 19 Haviland Ct
- 2518 Manchester Ave
- 2600 Giant Rd Unit 28
- 112 Westgate Cir
- 113 Westgate Cir
- 2796 13th St
- 2716 Holly St
- 2817 13th St
- 2872 10th St Unit 70
- 2854 16th St
- 2489 20th St
- 1905 Lovegrove Ave
- 2867 18th St
- 1780 Road 20
- 1552 Marelia Ct
- 2773 21st St
- 2830 21st St Unit 32
- 14433 San Pablo Ave
- 1961 Regello Ct
- 1111 Stonington Ave
- 17 Haviland Ct
- 11 Haviland Ct
- 1034 Trenton Blvd
- 1040 Trenton Blvd
- 21 Haviland Ct
- 1024 Trenton Blvd
- 23 Haviland Ct Unit 18
- 1016 Trenton Blvd
- 31 Haviland Ct
- 16 Haviland Ct
- 14 Haviland Ct
- 18 Haviland Ct
- 2618 Manchester Ave
- 2610 Manchester Ave
- 2650 Manchester Ave
- 30 Haviland Ct
- 20 Haviland Ct
- 2600 Manchester Ave
- 1004 Trenton Blvd
- 24 Haviland Ct