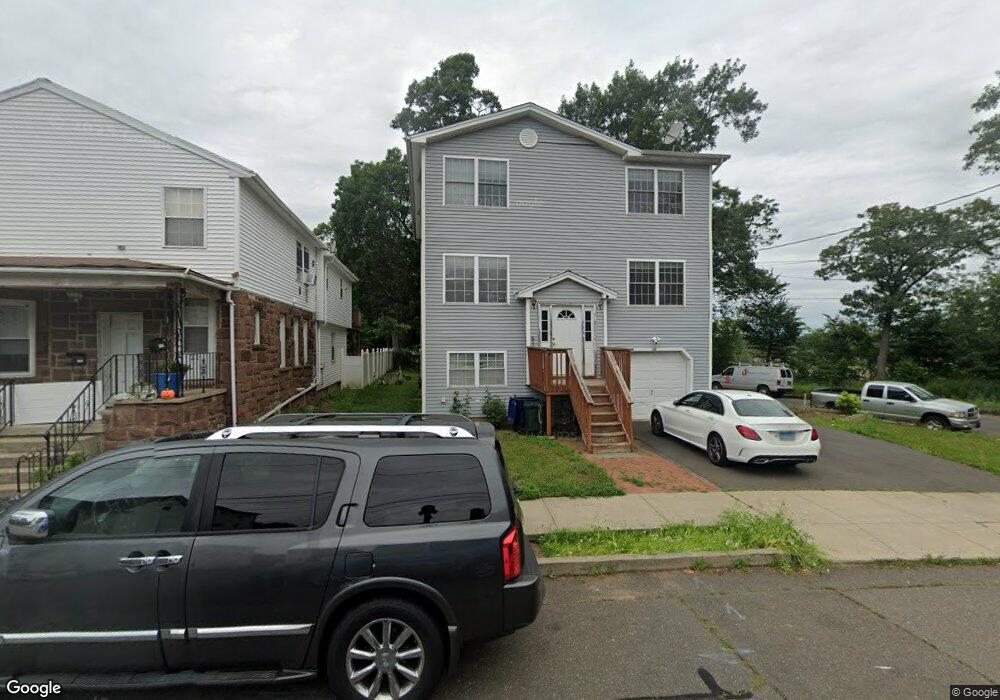
15 Hinman St West Haven, CT 06516
Allingtown NeighborhoodEstimated Value: $298,000 - $430,000
3
Beds
3
Baths
1,968
Sq Ft
$192/Sq Ft
Est. Value
About This Home
This home is located at 15 Hinman St, West Haven, CT 06516 and is currently estimated at $378,481, approximately $192 per square foot. 15 Hinman St is a home located in New Haven County with nearby schools including Carrigan 5/6 Intermediate School, Harry M. Bailey Middle School, and West Haven High School.
Ownership History
Date
Name
Owned For
Owner Type
Purchase Details
Closed on
May 21, 2021
Sold by
Patel Natubhai and Patel Janki
Bought by
Patel Rajendra and Patel Trushna
Current Estimated Value
Home Financials for this Owner
Home Financials are based on the most recent Mortgage that was taken out on this home.
Original Mortgage
$157,000
Outstanding Balance
$142,059
Interest Rate
3%
Mortgage Type
Purchase Money Mortgage
Estimated Equity
$236,422
Purchase Details
Closed on
Nov 14, 2007
Sold by
G P Developers Llc
Bought by
Patel Natubhai
Home Financials for this Owner
Home Financials are based on the most recent Mortgage that was taken out on this home.
Original Mortgage
$208,000
Interest Rate
6.41%
Mortgage Type
Purchase Money Mortgage
Purchase Details
Closed on
Jun 8, 2005
Sold by
Panza Sabino A and Panza John
Bought by
Prop Preservation Grp
Create a Home Valuation Report for This Property
The Home Valuation Report is an in-depth analysis detailing your home's value as well as a comparison with similar homes in the area
Home Values in the Area
Average Home Value in this Area
Purchase History
| Date | Buyer | Sale Price | Title Company |
|---|---|---|---|
| Patel Rajendra | $201,000 | None Available | |
| Patel Rajendra | $201,000 | None Available | |
| Patel Natubhai | $260,000 | -- | |
| Prop Preservation Grp | $52,000 | -- | |
| Patel Natubhai | $260,000 | -- | |
| Prop Preservation Grp | $52,000 | -- |
Source: Public Records
Mortgage History
| Date | Status | Borrower | Loan Amount |
|---|---|---|---|
| Open | Patel Rajendra | $157,000 | |
| Closed | Patel Rajendra | $157,000 | |
| Previous Owner | Prop Preservation Grp | $208,000 | |
| Previous Owner | Prop Preservation Grp | $7,900 |
Source: Public Records
Tax History Compared to Growth
Tax History
| Year | Tax Paid | Tax Assessment Tax Assessment Total Assessment is a certain percentage of the fair market value that is determined by local assessors to be the total taxable value of land and additions on the property. | Land | Improvement |
|---|---|---|---|---|
| 2025 | $8,790 | $258,440 | $58,870 | $199,570 |
| 2024 | $8,334 | $174,020 | $40,810 | $133,210 |
| 2023 | $8,078 | $174,020 | $40,810 | $133,210 |
| 2022 | $7,937 | $174,020 | $40,810 | $133,210 |
| 2021 | $7,939 | $174,020 | $40,810 | $133,210 |
| 2020 | $8,255 | $160,300 | $32,830 | $127,470 |
| 2019 | $8,127 | $160,300 | $32,830 | $127,470 |
| 2018 | $7,906 | $160,300 | $32,830 | $127,470 |
| 2017 | $7,659 | $160,300 | $32,830 | $127,470 |
| 2016 | $7,427 | $160,300 | $32,830 | $127,470 |
| 2015 | $6,839 | $168,070 | $36,540 | $131,530 |
| 2014 | $6,703 | $168,070 | $36,540 | $131,530 |
Source: Public Records
Map
Nearby Homes
- 103 Gilbert St
- 22 Bristol St
- 65 Westfield St
- 85 Porter St
- 29 Birch St
- 129 Winthrop Ave
- 58 Judson Ave
- 312 Davenport Ave
- 38 Chauncey St
- 14 Homestead Ave
- 65 Stevens St
- 56 Ann St
- 57 Stevens St
- 31 Greenwood St
- 60 Andrews St
- 262 Davenport Ave
- 247 Davenport Ave
- 98 Sylvan Ave
- 55 Sherman Ave
- 194 Ella T Grasso Blvd
- 21 Hinman St
- 23 Hinman St
- 29 Hinman St
- 22 Hinman St
- 2 Westfield St
- 49 Orlando St
- 45 Hinman St
- 6 Westfield St
- 53 Orlando St
- 12 Westfield St
- 57 Orlando St
- 14 Westfield St Unit 1
- 51 Hinman St
- 61 Orlando St
- 113 Gilbert St
- 34 Orlando St
- 38 Orlando St
- 38 Orlando St Unit 2
- 65-67 Orlando St 1st Floor
- 121 Gilbert St