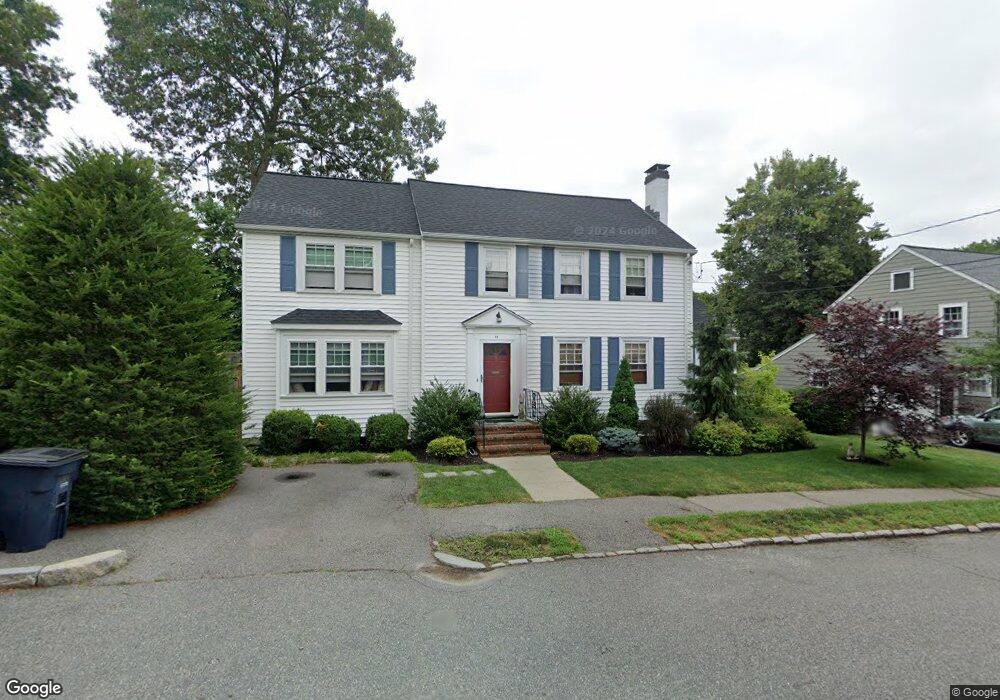
15 Hobson St Roslindale, MA 02131
Roslindale NeighborhoodEstimated Value: $902,693 - $1,054,000
4
Beds
3
Baths
2,030
Sq Ft
$481/Sq Ft
Est. Value
About This Home
This home is located at 15 Hobson St, Roslindale, MA 02131 and is currently estimated at $975,423, approximately $480 per square foot. 15 Hobson St is a home located in Suffolk County with nearby schools including Holy Name Parish School, Sacred Heart STEM School, and The Roxbury Latin School.
Ownership History
Date
Name
Owned For
Owner Type
Purchase Details
Closed on
Sep 21, 2020
Sold by
Sullivan William J and Sullivan Mary K
Bought by
W J Sullivan 2020 Ret
Current Estimated Value
Purchase Details
Closed on
May 11, 1987
Sold by
Sexton Pauline Est
Bought by
Sullivan William J
Create a Home Valuation Report for This Property
The Home Valuation Report is an in-depth analysis detailing your home's value as well as a comparison with similar homes in the area
Home Values in the Area
Average Home Value in this Area
Purchase History
| Date | Buyer | Sale Price | Title Company |
|---|---|---|---|
| W J Sullivan 2020 Ret | -- | None Available | |
| Sullivan William J | $180,000 | -- |
Source: Public Records
Mortgage History
| Date | Status | Borrower | Loan Amount |
|---|---|---|---|
| Previous Owner | Sullivan William J | $226,000 | |
| Previous Owner | Sullivan William J | $122,000 | |
| Previous Owner | Sullivan William J | $145,000 | |
| Previous Owner | Sullivan William J | $148,500 |
Source: Public Records
Tax History Compared to Growth
Tax History
| Year | Tax Paid | Tax Assessment Tax Assessment Total Assessment is a certain percentage of the fair market value that is determined by local assessors to be the total taxable value of land and additions on the property. | Land | Improvement |
|---|---|---|---|---|
| 2025 | $7,972 | $688,400 | $213,100 | $475,300 |
| 2024 | $8,035 | $737,200 | $245,900 | $491,300 |
| 2023 | $7,541 | $702,100 | $234,200 | $467,900 |
| 2022 | $6,820 | $626,800 | $209,100 | $417,700 |
| 2021 | $6,304 | $590,800 | $199,100 | $391,700 |
| 2020 | $6,062 | $574,100 | $171,600 | $402,500 |
| 2019 | $5,657 | $536,700 | $138,400 | $398,300 |
| 2018 | $5,210 | $497,100 | $138,400 | $358,700 |
| 2017 | $4,920 | $464,600 | $138,400 | $326,200 |
| 2016 | $4,961 | $451,000 | $138,400 | $312,600 |
| 2015 | $4,975 | $410,800 | $126,100 | $284,700 |
| 2014 | $4,694 | $373,100 | $126,100 | $247,000 |
Source: Public Records
Map
Nearby Homes
- 150 Aldrich St
- 276 Cornell St
- 105 Orange St
- 34 Averton St
- 59 Aldrich St Unit 2
- 43 Aldrich St
- 40 Newburg St Unit 1
- 15 White Oak Rd
- 37 Montvale St Unit 2
- 242 Belgrade Ave
- 15 Newburg St Unit 1
- 257 Belgrade Ave
- 296 Kittredge St Unit 298
- 142 Birch St
- 142 Birch St Unit 2
- 142 Birch St Unit 1
- 104 Stratford St
- 311 Belgrade Ave
- 52 Metropolitan Ave Unit 3
- 69 Metropolitan Ave
- 9 Hobson St
- 175 Orange St
- 179 Orange St Unit 181
- 171 Orange St
- 14 Hobson St
- 183 Orange St Unit 185
- 10 Hobson St
- 5 Hobson St
- 183-185 Orange St Unit 2
- 185 Orange St Unit 2
- 187 Orange St
- 6 Hobson St
- 167 Orange St
- 167 Orange St Unit 167
- 169 Orange St Unit 169
- 173 Orange St
- 241 Beech St
- 241 Beech St Unit 2
- 241 Beech St Unit 1
- 191 Orange St