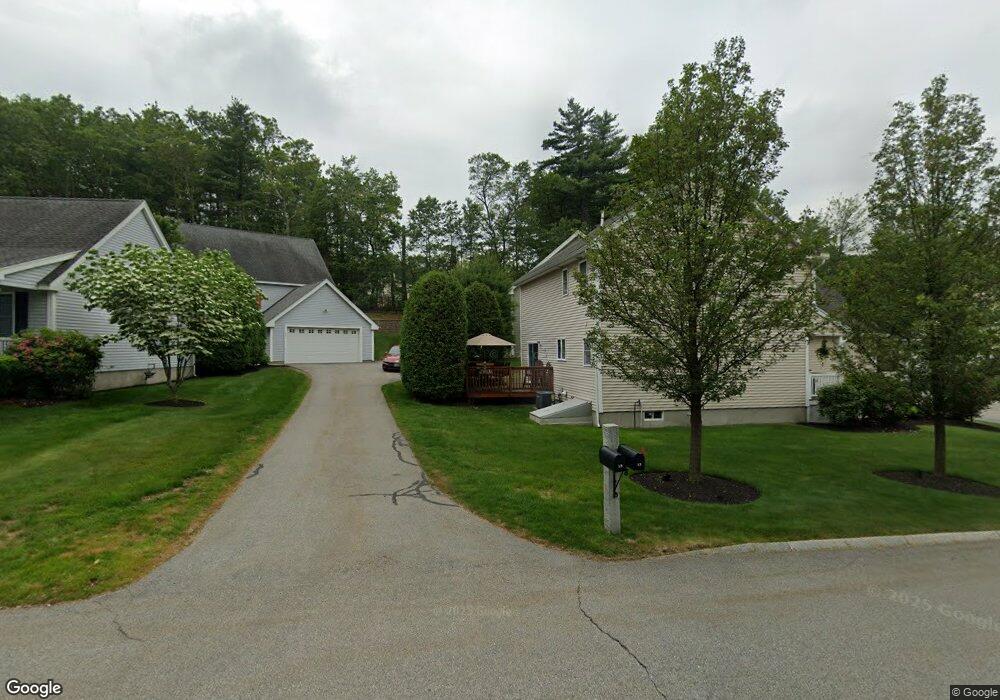
15 Hollow Ridge Dr Unit 7 Nashua, NH 03062
West Hollis NeighborhoodEstimated Value: $533,000 - $635,000
3
Beds
3
Baths
1,670
Sq Ft
$354/Sq Ft
Est. Value
About This Home
This home is located at 15 Hollow Ridge Dr Unit 7, Nashua, NH 03062 and is currently estimated at $591,816, approximately $354 per square foot. 15 Hollow Ridge Dr Unit 7 is a home located in Hillsborough County with nearby schools including Ledge Street Elementary School, Elm Street Middle School, and Nashua High School South.
Ownership History
Date
Name
Owned For
Owner Type
Purchase Details
Closed on
Nov 19, 2021
Sold by
Chandonnet Castele J
Bought by
Curtis Kevin A
Current Estimated Value
Home Financials for this Owner
Home Financials are based on the most recent Mortgage that was taken out on this home.
Original Mortgage
$477,000
Outstanding Balance
$437,088
Interest Rate
2.99%
Mortgage Type
Purchase Money Mortgage
Estimated Equity
$154,728
Purchase Details
Closed on
Jan 30, 2015
Sold by
Belleau Jesse
Bought by
Chandonnet Celeste J
Home Financials for this Owner
Home Financials are based on the most recent Mortgage that was taken out on this home.
Original Mortgage
$238,400
Interest Rate
3.81%
Purchase Details
Closed on
Mar 7, 2012
Sold by
Dwa Hollis Props
Bought by
Belleau Jesse
Create a Home Valuation Report for This Property
The Home Valuation Report is an in-depth analysis detailing your home's value as well as a comparison with similar homes in the area
Home Values in the Area
Average Home Value in this Area
Purchase History
| Date | Buyer | Sale Price | Title Company |
|---|---|---|---|
| Curtis Kevin A | $477,000 | None Available | |
| Curtis Kevin A | $477,000 | None Available | |
| Chandonnet Celeste J | $298,000 | -- | |
| Chandonnet Celeste J | $298,000 | -- | |
| Belleau Jesse | $278,900 | -- | |
| Belleau Jesse | $278,900 | -- |
Source: Public Records
Mortgage History
| Date | Status | Borrower | Loan Amount |
|---|---|---|---|
| Open | Curtis Kevin A | $477,000 | |
| Closed | Curtis Kevin A | $477,000 | |
| Previous Owner | Chandonnet Celeste J | $238,400 | |
| Closed | Belleau Jesse | $0 |
Source: Public Records
Tax History Compared to Growth
Tax History
| Year | Tax Paid | Tax Assessment Tax Assessment Total Assessment is a certain percentage of the fair market value that is determined by local assessors to be the total taxable value of land and additions on the property. | Land | Improvement |
|---|---|---|---|---|
| 2024 | $9,139 | $574,800 | $0 | $574,800 |
| 2023 | $8,659 | $475,000 | $0 | $475,000 |
| 2022 | $8,583 | $475,000 | $0 | $475,000 |
| 2021 | $8,180 | $352,300 | $0 | $352,300 |
| 2020 | $7,966 | $352,300 | $0 | $352,300 |
| 2019 | $7,666 | $352,300 | $0 | $352,300 |
| 2018 | $7,472 | $352,300 | $0 | $352,300 |
| 2017 | $8,485 | $329,000 | $0 | $329,000 |
| 2016 | $8,248 | $329,000 | $0 | $329,000 |
| 2015 | $8,070 | $329,000 | $0 | $329,000 |
| 2014 | $7,828 | $325,500 | $0 | $325,500 |
Source: Public Records
Map
Nearby Homes
- 247 Main Dunstable Rd
- 8 Althea Ln Unit U26
- 599 W Hollis St
- 47 Dogwood Dr Unit U202
- 11 Bordeaux St
- 41 New Dunstable Rd Unit 371
- 16 Laurel Ct Unit U320
- 27 Country Hill Rd Unit U90
- 4 Henry David Dr Unit 203
- 22 New Dunstable Rd Unit 132133
- 40 Spring Cove Rd Unit U117
- 22 Kern Dr
- 12 Spring Cove Rd Unit U103
- 4 Nelson St
- 5 Meghan Dr Unit U23
- 3 Richmond St
- 46 Scenic Dr
- 25 Cortez Dr Unit U57
- 6 Cornwall Ln Unit 7
- 424 Broad St
- 15 Hollow Ridge Dr
- 17 Hollow Ridge Dr Unit 17
- 17 Hollow Ridge Dr
- 13 Hollow Ridge Dr Unit 13
- 11 Hollow Ridge Dr Unit 11
- 19 Hollow Ridge Dr Unit Lot 8
- 19 Hollow Ridge Dr Unit 8
- 9 Hollow Ridge Dr Unit 9
- 9 Hollow Ridge Dr
- 21 Hollow Ridge Dr Unit 45
- 5 Hollow Ridge Dr Unit 5
- 23 Hollow Ridge Dr
- 23 Hollow Ridge Dr
- 23 Hollow Ridge Dr Unit 49
- 23 Hollow Ridge Dr Unit 23
- 7 Hollow Ridge Dr Unit 7
- 7 Hollow Ridge Dr Unit 2
- 25 Hollow Ridge Dr Unit 25
- 27 Hollow Ridge Dr Unit 27
- Lot 32 #46 Hollow Ridge Dr