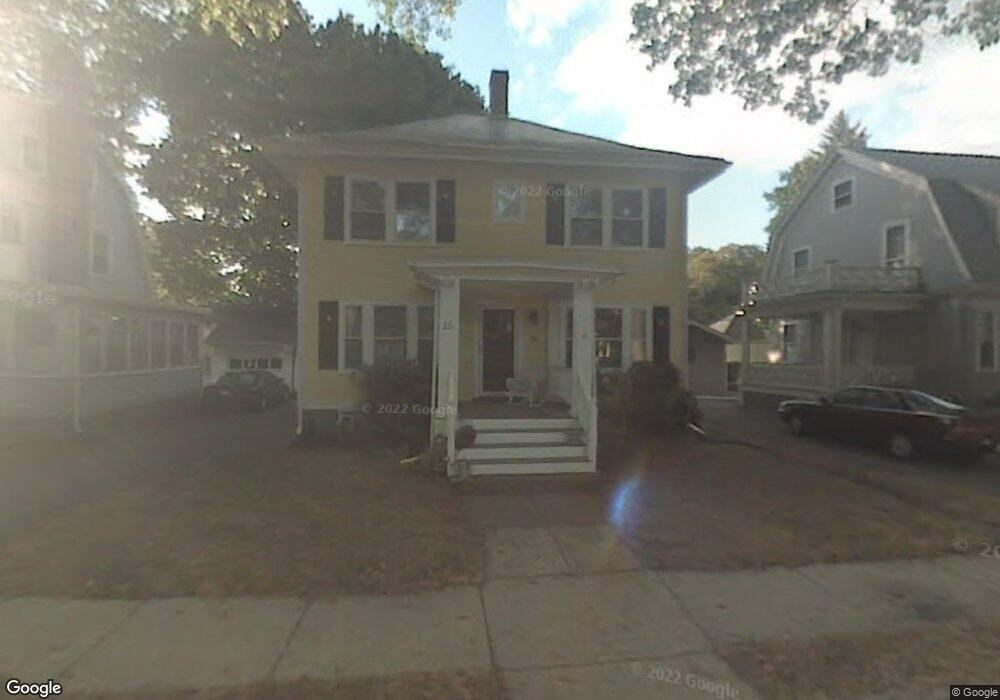
15 Howitt Rd West Roxbury, MA 02132
Bellevue Hill NeighborhoodEstimated Value: $860,000 - $1,052,000
3
Beds
2
Baths
1,550
Sq Ft
$616/Sq Ft
Est. Value
About This Home
This home is located at 15 Howitt Rd, West Roxbury, MA 02132 and is currently estimated at $955,332, approximately $616 per square foot. 15 Howitt Rd is a home located in Suffolk County with nearby schools including St Theresa School, Holy Name Parish School, and The Roxbury Latin School.
Ownership History
Date
Name
Owned For
Owner Type
Purchase Details
Closed on
Aug 3, 1998
Sold by
Ramsden Matthew E and Ramsden Linda
Bought by
Mcgurn Kevin M and Mcgurn Eileen
Current Estimated Value
Purchase Details
Closed on
Aug 29, 1994
Sold by
Fitzpatrick Christine
Bought by
Ramsden Matthew E and Ramsden Linda
Purchase Details
Closed on
Aug 30, 1988
Sold by
Ryan William E
Bought by
Fitzpatrick Chris M
Create a Home Valuation Report for This Property
The Home Valuation Report is an in-depth analysis detailing your home's value as well as a comparison with similar homes in the area
Home Values in the Area
Average Home Value in this Area
Purchase History
| Date | Buyer | Sale Price | Title Company |
|---|---|---|---|
| Mcgurn Kevin M | $262,500 | -- | |
| Ramsden Matthew E | $210,000 | -- | |
| Fitzpatrick Chris M | $195,000 | -- |
Source: Public Records
Mortgage History
| Date | Status | Borrower | Loan Amount |
|---|---|---|---|
| Open | Fitzpatrick Chris M | $225,000 | |
| Closed | Fitzpatrick Chris M | $197,000 |
Source: Public Records
Tax History Compared to Growth
Tax History
| Year | Tax Paid | Tax Assessment Tax Assessment Total Assessment is a certain percentage of the fair market value that is determined by local assessors to be the total taxable value of land and additions on the property. | Land | Improvement |
|---|---|---|---|---|
| 2025 | $9,251 | $798,900 | $298,100 | $500,800 |
| 2024 | $8,037 | $737,300 | $280,200 | $457,100 |
| 2023 | $7,471 | $695,600 | $264,300 | $431,300 |
| 2022 | $6,881 | $632,400 | $240,300 | $392,100 |
| 2021 | $6,434 | $603,000 | $233,300 | $369,700 |
| 2020 | $5,988 | $567,000 | $216,400 | $350,600 |
| 2019 | $5,566 | $528,100 | $185,900 | $342,200 |
| 2018 | $5,268 | $502,700 | $185,900 | $316,800 |
| 2017 | $5,270 | $497,600 | $185,900 | $311,700 |
| 2016 | $5,020 | $456,400 | $185,900 | $270,500 |
| 2015 | $5,035 | $415,800 | $156,100 | $259,700 |
| 2014 | $4,885 | $388,300 | $156,100 | $232,200 |
Source: Public Records
Map
Nearby Homes
- 73 Woodard Rd
- 275 Bellevue St
- 54 Sturges Rd
- 145 Lagrange St
- 152 Stratford St
- 348 Lagrange St
- 12 Loyola Cir
- 425 Lagrange St Unit 203
- 110 Park St Unit 3
- 416 Belgrade Ave Unit 25
- 27-29 Temple St
- 12 Eagle St
- 2 Lagrange St Unit 4
- 37 Hastings St Unit 103
- 50 Heron St
- 311 Belgrade Ave
- 2231 Centre St
- 95 Newburg St
- 35 Heron St
- 73 Dent St Unit 1