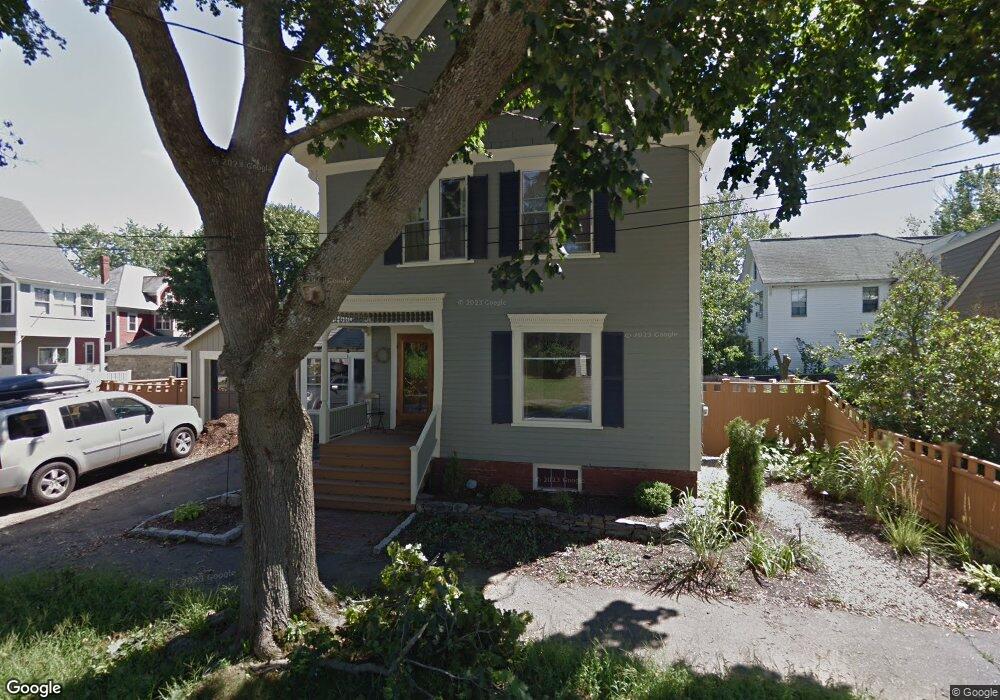
15 Humphrey St Concord, NH 03301
South End NeighborhoodEstimated Value: $476,856 - $513,000
3
Beds
2
Baths
1,657
Sq Ft
$302/Sq Ft
Est. Value
About This Home
This home is located at 15 Humphrey St, Concord, NH 03301 and is currently estimated at $499,964, approximately $301 per square foot. 15 Humphrey St is a home located in Merrimack County with nearby schools including Abbot-Downing School, Rundlett Middle School, and Concord High School.
Ownership History
Date
Name
Owned For
Owner Type
Purchase Details
Closed on
Mar 30, 2006
Sold by
Munson Michael L and Munson Michele L
Bought by
Sawyer Mathew M and Sawyer Dina-Marie M
Current Estimated Value
Home Financials for this Owner
Home Financials are based on the most recent Mortgage that was taken out on this home.
Original Mortgage
$316,600
Interest Rate
6.32%
Mortgage Type
Purchase Money Mortgage
Create a Home Valuation Report for This Property
The Home Valuation Report is an in-depth analysis detailing your home's value as well as a comparison with similar homes in the area
Home Values in the Area
Average Home Value in this Area
Purchase History
| Date | Buyer | Sale Price | Title Company |
|---|---|---|---|
| Sawyer Mathew M | $316,600 | -- |
Source: Public Records
Mortgage History
| Date | Status | Borrower | Loan Amount |
|---|---|---|---|
| Open | Sawyer Mathew M | $233,750 | |
| Closed | Sawyer Mathew M | $316,600 |
Source: Public Records
Tax History Compared to Growth
Tax History
| Year | Tax Paid | Tax Assessment Tax Assessment Total Assessment is a certain percentage of the fair market value that is determined by local assessors to be the total taxable value of land and additions on the property. | Land | Improvement |
|---|---|---|---|---|
| 2024 | $9,210 | $332,600 | $107,700 | $224,900 |
| 2023 | $8,934 | $332,600 | $107,700 | $224,900 |
| 2022 | $8,611 | $332,600 | $107,700 | $224,900 |
| 2021 | $8,270 | $329,200 | $107,700 | $221,500 |
| 2020 | $8,039 | $300,400 | $86,000 | $214,400 |
| 2019 | $7,420 | $267,100 | $84,300 | $182,800 |
| 2018 | $7,225 | $256,300 | $84,300 | $172,000 |
| 2017 | $6,922 | $245,100 | $84,300 | $160,800 |
| 2016 | $6,563 | $237,200 | $82,800 | $154,400 |
| 2015 | $6,201 | $222,800 | $86,400 | $136,400 |
| 2014 | $5,973 | $222,800 | $86,400 | $136,400 |
| 2013 | -- | $222,800 | $86,400 | $136,400 |
| 2012 | -- | $226,300 | $86,400 | $139,900 |
Source: Public Records
Map
Nearby Homes
- 122 South St
- 12 Avon St
- 0 Spruce St Unit 88
- 33 Spruce St
- 24 Badger St
- 0 South St Unit 4969509
- 105 S Main St
- 47 South St
- 14 Downing St
- 75 S State St
- 14-16 Perley St
- 22 Wilson Ave
- 15 Wilson Ave
- 10 Perley St
- 87 S Main St Unit 2
- 4 Fayette St
- 54 Pleasant St Unit 8
- 376 S Main St
- 2 Kensington Rd
- 1 Kensington Rd