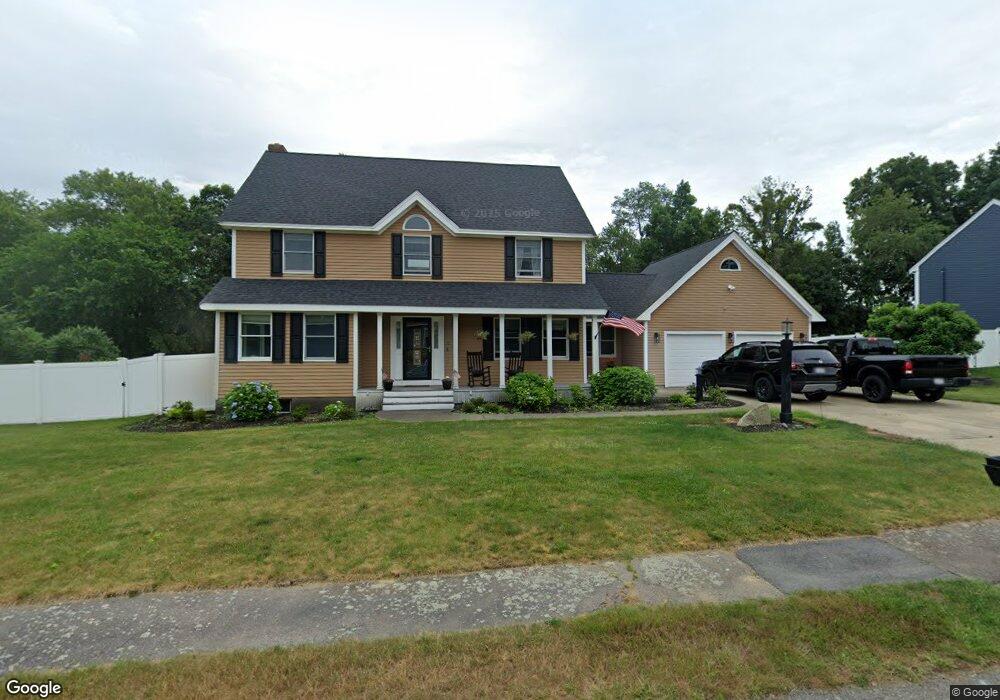
15 Jacobs Ln Whitman, MA 02382
Estimated Value: $769,000 - $927,000
About This Home
This home is located at 15 Jacobs Ln, Whitman, MA 02382 and is currently estimated at $840,605, approximately $287 per square foot. 15 Jacobs Ln is a home with nearby schools including St Bridget School.
Ownership History
We collect this data history from publicly available records. To have your information removed, we recommend requesting removal directly through your county’s website.
Purchase Details
Home Financials for this Owner
Home Financials are based on the most recent Mortgage that was taken out on this home.Home Values in the Area
Average Home Value in this Area
Purchase History
We collect this data history from publicly available records. To have your information removed, we recommend requesting removal directly through your county’s website.
| Date | Buyer | Sale Price | Title Company |
|---|---|---|---|
| $385,000 | -- | ||
| $385,000 | -- |
Mortgage History
We collect this data history from publicly available records. To have your information removed, we recommend requesting removal directly through your county’s website.
| Date | Status | Borrower | Loan Amount |
|---|---|---|---|
| Open | $355,750 | ||
| Closed | $355,750 | ||
| Previous Owner | $312,000 |
Tax History
We collect this data history from publicly available records. To have your information removed, we recommend requesting removal directly through your county’s website.
| Year | Tax Paid | Tax Assessment Tax Assessment Total Assessment is a certain percentage of the fair market value that is determined by local assessors to be the total taxable value of land and additions on the property. | Land | Improvement |
|---|---|---|---|---|
| 2025 | $8,827 | $672,800 | $245,200 | $427,600 |
| 2024 | $8,146 | $639,400 | $240,800 | $398,600 |
| 2023 | $7,717 | $568,700 | $209,500 | $359,200 |
| 2022 | $7,634 | $524,300 | $190,100 | $334,200 |
| 2021 | $7,339 | $473,500 | $167,400 | $306,100 |
| 2020 | $7,205 | $454,600 | $158,800 | $295,800 |
| 2019 | $6,913 | $449,500 | $158,800 | $290,700 |
| 2018 | $6,433 | $401,800 | $145,800 | $256,000 |
| 2017 | $6,059 | $401,800 | $145,800 | $256,000 |
| 2016 | $6,058 | $388,600 | $140,400 | $248,200 |
| 2015 | $6,066 | $388,600 | $140,400 | $248,200 |
Map
- 1012 Washington St
- 173 Alden St
- 37 Lakeview St
- 751 Washington St
- 300 High St
- 34 Brockton Ave
- 360 High St
- 23 Belmont St
- 285 Raynor Ave
- 206 High St
- 70 Groveland St
- 518 Summer St
- 154 Bedford St
- 38 Carleton St
- 9 Lydon Ln Unit C2
- 6 Colebrook Blvd Unit 7
- 143 Cranberry Rd
- 646 Bedford St Unit C1
- 13 Mahoney Cir
- 55 Clapp St
Ask me questions while you tour the home.