Estimated payment $1,220/month
Highlights
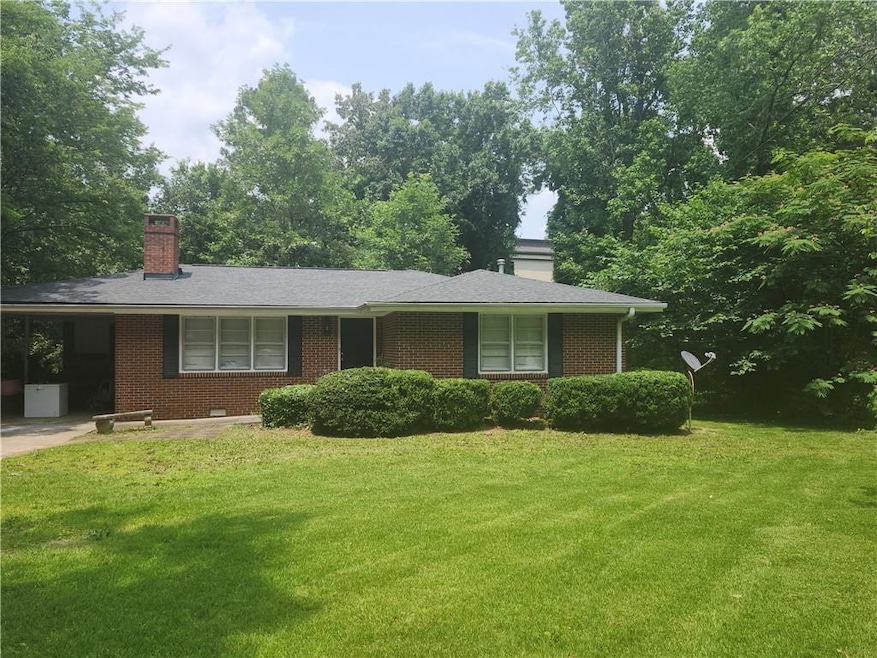
- View of Trees or Woods
- Traditional Architecture
- 1-Story Property
- Private Lot
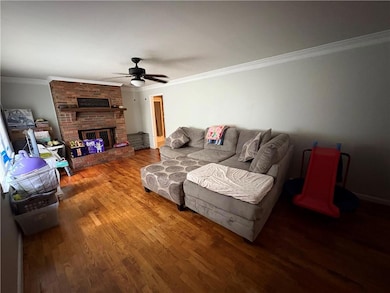
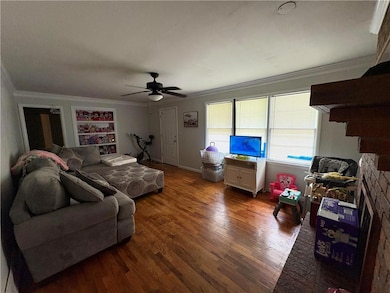
- Wood Flooring
- Landscaped
About This Home
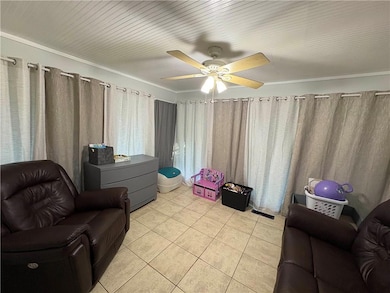
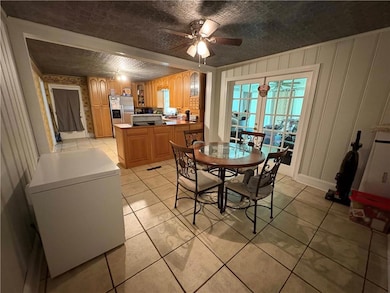
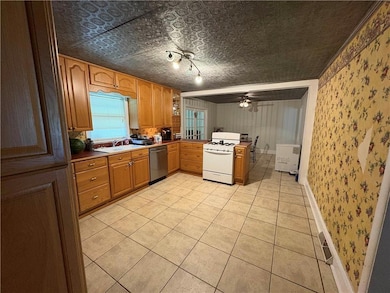
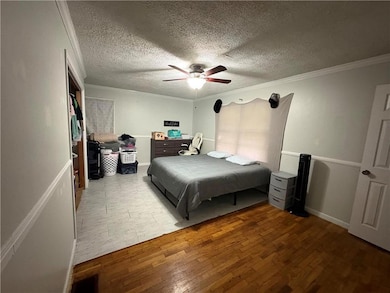
This delightful ranch-style residence offers classic charm with a welcoming front yard and a location just minutes from Rome’s popular shopping and dining spots. Inside, gleaming hardwood floors lead you through a comfortable living space anchored by a cozy fireplace—perfect for relaxing evenings. The kitchen features abundant cabinet storage and a layout ideal for both everyday use and entertaining. Each bedroom provides a peaceful retreat with natural light and inviting comfort. Step outside to a private backyard, a serene space surrounded by mature greenery, ideal for outdoor dining, gardening, or quiet mornings with a cup of coffee. A perfect blend of convenience and comfort in a tranquil setting.
Home Details
Home Type
- Single Family
Est. Annual Taxes
- $1,629
Year Built
- Built in 1958
Lot Details
- 0.48 Acre Lot
- Lot Dimensions are 192 x 109
- Landscaped
- Private Lot
- Back and Front Yard
Parking
- 1 Carport Space
Property Views
- Woods
- Neighborhood
Home Design
- Traditional Architecture
- Brick Exterior Construction
Interior Spaces
- 1,386 Sq Ft Home
- 1-Story Property
- Family Room with Fireplace
- Wood Flooring
- Crawl Space
Kitchen
- Electric Oven
- Dishwasher
Bedrooms and Bathrooms
- 2 Main Level Bedrooms
- 1 Full Bathroom
Schools
- West End Elementary School
- Rome Middle School
- Rome High School
Utilities
- Central Heating and Cooling System
- Underground Utilities
Community Details
- Cherokee Acres Subdivision
Listing and Financial Details
- Tax Lot 32
- Assessor Parcel Number H13J 169
Map
Home Values in the Area
Average Home Value in this Area
Tax History
| Year | Tax Paid | Tax Assessment Tax Assessment Total Assessment is a certain percentage of the fair market value that is determined by local assessors to be the total taxable value of land and additions on the property. | Land | Improvement |
|---|---|---|---|---|
| 2024 | $2,792 | $72,945 | $14,327 | $58,618 |
| 2023 | $2,212 | $62,993 | $12,940 | $50,053 |
| 2022 | $1,934 | $53,003 | $10,630 | $42,373 |
| 2021 | $1,624 | $43,781 | $10,630 | $33,151 |
| 2020 | $1,450 | $38,765 | $8,088 | $30,677 |
| 2019 | $1,372 | $37,072 | $8,088 | $28,984 |
| 2018 | $1,231 | $33,269 | $8,088 | $25,181 |
| 2017 | $1,199 | $32,373 | $8,088 | $24,285 |
| 2016 | $1,310 | $35,276 | $8,080 | $27,196 |
| 2015 | $1,209 | $35,276 | $8,080 | $27,196 |
| 2014 | $1,209 | $34,488 | $8,080 | $26,408 |
Property History
| Date | Event | Price | List to Sale | Price per Sq Ft |
|---|---|---|---|---|
| 06/10/2025 06/10/25 | For Sale | $205,900 | -- | $149 / Sq Ft |
Purchase History
| Date | Type | Sale Price | Title Company |
|---|---|---|---|
| Warranty Deed | $187,000 | -- | |
| Deed | -- | -- | |
| Deed | $56,600 | -- | |
| Deed | $56,600 | -- | |
| Warranty Deed | $54,000 | -- | |
| Deed | -- | -- | |
| Deed | -- | -- |
Mortgage History
| Date | Status | Loan Amount | Loan Type |
|---|---|---|---|
| Open | $183,612 | New Conventional | |
| Previous Owner | $53,580 | FHA |
Source: First Multiple Listing Service (FMLS)
MLS Number: 7591168
APN: H13J-169
Disclaimer: Certain information contained herein is derived from information provided by parties other than Homes.com. All information provided is deemed reliable, but is not guaranteed to be accurate and should be independently verified.
![]() Listings identified with the FMLS IDX logo come from FMLS and are held by brokerage firms other than the owner of this website. The listing brokerage is identified in any listing details. Information is deemed reliable but is not guaranteed. If you believe any FMLS listing contains material that infringes your copyrighted work please visit www.fmls.com/dmca to review our DMCA policy and learn how to submit a takedown request. © 2025 First Multiple Listing Service, Inc.
Listings identified with the FMLS IDX logo come from FMLS and are held by brokerage firms other than the owner of this website. The listing brokerage is identified in any listing details. Information is deemed reliable but is not guaranteed. If you believe any FMLS listing contains material that infringes your copyrighted work please visit www.fmls.com/dmca to review our DMCA policy and learn how to submit a takedown request. © 2025 First Multiple Listing Service, Inc.
- 200 Coosawattee Ave SW
- 3 Oak Ridge Ct NE
- 209 Larkspur Ln SW
- 43 Westwood Cir SW
- 216 Coosawattee Ave SW
- 25 Ridge Dr SW
- 40 Westwood Cir SW
- 16 Jefferson Dr SW
- 0 Cedartown Rd Unit 10479932
- 108 Deerbrook Dr SW
- 26 Jefferson Dr SW
- 209 Brown Fox Dr SW
- 0 Westlyn Dr Unit 10599621
- 0 Westlyn Dr Unit 7645405
- 18 Butler Cir NW
- 3 Lovell Ln SW
- 1 Westlyn Dr SW
- 103 Wooten Dr SW
- 107 E Clinton Dr SW
- 109 Larkspur Ln SW
- 34 Lyons Dr NW Unit A
- 6 Westlyn Dr SW
- 10 Burnett Ferry Rd SW Unit FL1-ID1345541P
- 10 Burnett Ferry Rd SW
- 8 Westridge Cir SW
- 1 Silverbell Ln
- 122 Malone Dr NW
- 122 Malone Dr NW Unit FL1-ID1345543P
- 105 Asbury Dr
- 1349 Redmond Cir NW
- 600 Redmond Rd NW
- 100 Woodrow Wilson Way NW
- 204 Oakwood St NW
- 111 Charlton St NW
- 108 Oakwood St NW
- 1005 N 2nd Ave NW Unit 32
- 1005 N 2nd Ave NW
- 1005 N 2nd Ave NW Unit 33
- 1005 N 2nd Ave NW Unit 39
