15 John St Stony Point, NY 10980
Estimated Value: $552,000 - $580,000
4
Beds
2
Baths
1,512
Sq Ft
$373/Sq Ft
Est. Value
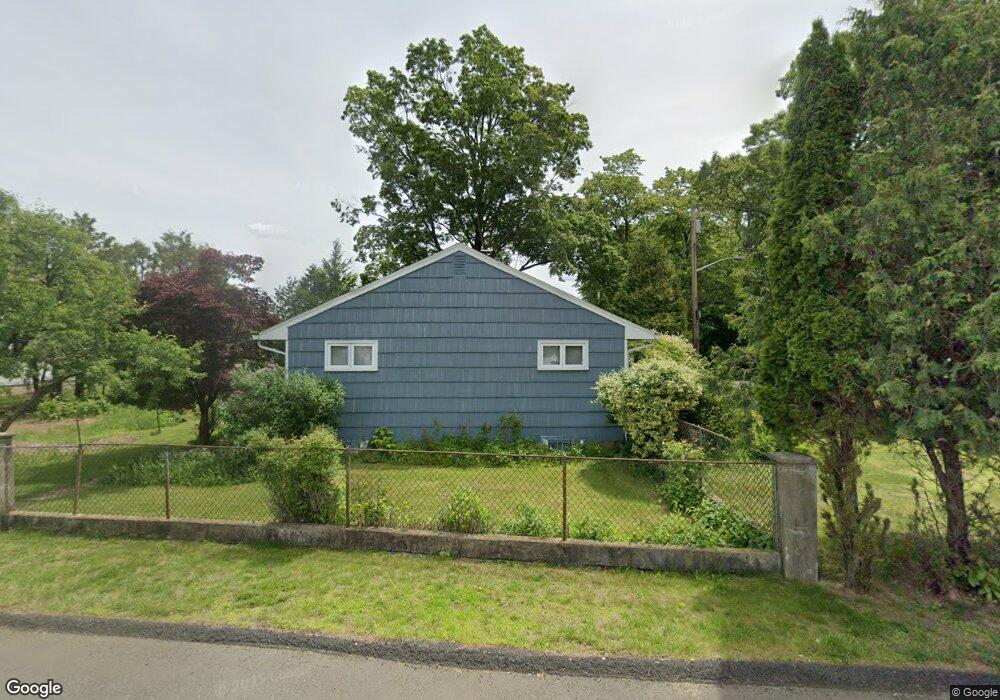
About This Home
This home is located at 15 John St, Stony Point, NY 10980 and is currently estimated at $563,917, approximately $372 per square foot. 15 John St is a home located in Rockland County with nearby schools including James A. Farley Middle School, Stony Point Elementary School, and Fieldstone Secondary School.
Ownership History
Date
Name
Owned For
Owner Type
Purchase Details
Closed on
Mar 7, 2013
Sold by
Zavodsky Carol and Morelli Giulietta
Bought by
Zavodsky Danielle and Zavodsky Marissa
Current Estimated Value
Purchase Details
Closed on
Nov 19, 2007
Sold by
Morelli Giulietta
Bought by
Zavodsky Carol
Purchase Details
Closed on
Dec 30, 1996
Sold by
Morelli Fred and Morelli Giulietta
Bought by
Morelli Giulietta
Create a Home Valuation Report for This Property
The Home Valuation Report is an in-depth analysis detailing your home's value as well as a comparison with similar homes in the area
Home Values in the Area
Average Home Value in this Area
Purchase History
| Date | Buyer | Sale Price | Title Company |
|---|---|---|---|
| Zavodsky Danielle | -- | None Available | |
| Zavodsky Danielle | -- | None Available | |
| Zavodsky Carol | -- | Ny & Nj Title Ins Agency | |
| Zavodsky Carol | -- | Ny & Nj Title Ins Agency | |
| Morelli Giulietta | -- | Lawyers Title | |
| Morelli Giulietta | -- | Lawyers Title |
Source: Public Records
Tax History
| Year | Tax Paid | Tax Assessment Tax Assessment Total Assessment is a certain percentage of the fair market value that is determined by local assessors to be the total taxable value of land and additions on the property. | Land | Improvement |
|---|---|---|---|---|
| 2022 | $3,859 | $42,000 | $7,700 | $34,300 |
| 2021 | $3,859 | $42,000 | $7,700 | $34,300 |
| 2020 | $10,032 | $42,000 | $7,700 | $34,300 |
| 2019 | $3,237 | $42,000 | $7,700 | $34,300 |
| 2018 | $9,628 | $42,000 | $7,700 | $34,300 |
| 2017 | $9,458 | $42,000 | $7,700 | $34,300 |
| 2016 | $9,768 | $42,000 | $7,700 | $34,300 |
| 2015 | -- | $42,000 | $7,700 | $34,300 |
| 2014 | -- | $42,000 | $7,700 | $34,300 |
Source: Public Records
Map
Nearby Homes
- 74 Beach Rd
- 30 Ba Mar Dr
- 32 Ba Mar Dr
- 61 E Main St
- 73 Tomkins Ave
- 27 Hunter Place
- 36 N Liberty Dr
- 15 Wenzel Ln
- 4 Jay St
- 21 Janet Place
- 807 Battalion Dr
- 30 Govan Dr
- 57 Mountain View Mobile Home Park
- 9 Georgian Dr
- 30 Chestnut St Ny St
- 122 Jay St
- 50 Major Andre Dr
- 8 Autumn Ln
- 89 Benson St
- 23 Sunrise Dr
Your Personal Tour Guide
Ask me questions while you tour the home.