15 Kathy Way Pittsfield, MA 01201
Estimated Value: $461,000 - $526,000
3
Beds
3
Baths
1,815
Sq Ft
$268/Sq Ft
Est. Value
About This Home
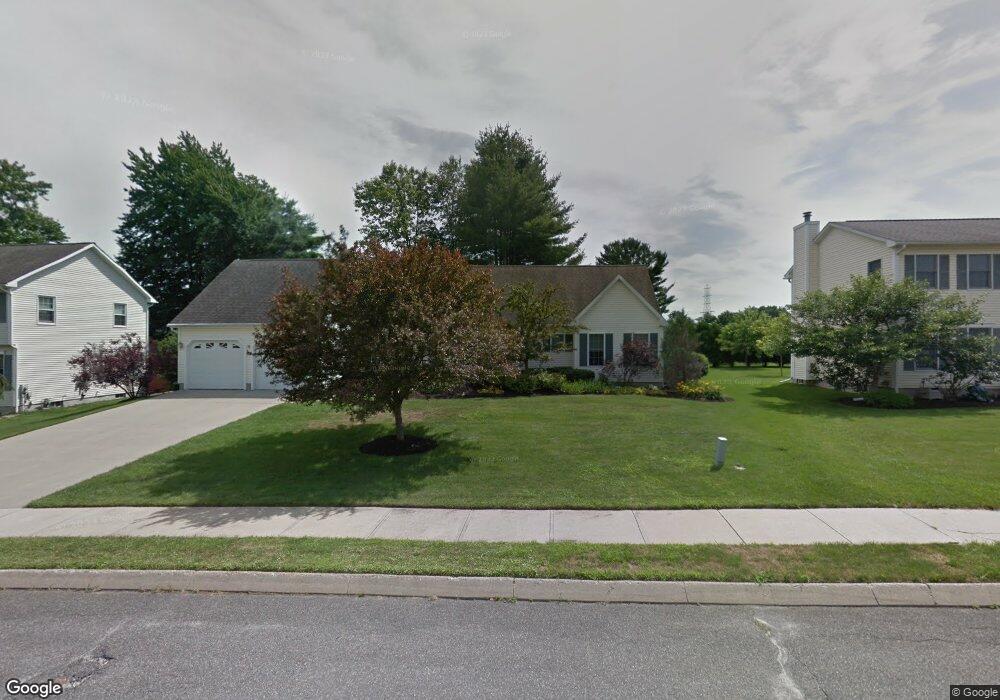
This home is located at 15 Kathy Way, Pittsfield, MA 01201 and is currently estimated at $486,998, approximately $268 per square foot. 15 Kathy Way is a home located in Berkshire County with nearby schools including Egremont Elementary School, Theodore Herberg Middle School, and Sinai Academy of the Berkshires.
Ownership History
Date
Name
Owned For
Owner Type
Purchase Details
Closed on
Sep 21, 2023
Sold by
Durant Alexander P
Bought by
Alexander P Durant Ft and Durant
Current Estimated Value
Purchase Details
Closed on
Jul 17, 2000
Sold by
Maple Grove Dr Nt and Morduck
Bought by
Durant Alexander P and Durant Frances A
Create a Home Valuation Report for This Property
The Home Valuation Report is an in-depth analysis detailing your home's value as well as a comparison with similar homes in the area
Home Values in the Area
Average Home Value in this Area
Purchase History
| Date | Buyer | Sale Price | Title Company |
|---|---|---|---|
| Alexander P Durant Ft | -- | None Available | |
| Alexander P Durant Ft | -- | None Available | |
| Alexander P Durant Ft | -- | None Available | |
| Durant Alexander P | $48,000 | -- | |
| Durant Alexander P | $48,000 | -- |
Source: Public Records
Mortgage History
| Date | Status | Borrower | Loan Amount |
|---|---|---|---|
| Previous Owner | Durant Alexander P | $138,000 | |
| Previous Owner | Durant Alexander P | $17,000 | |
| Previous Owner | Durant Alexander P | $151,000 |
Source: Public Records
Tax History Compared to Growth
Tax History
| Year | Tax Paid | Tax Assessment Tax Assessment Total Assessment is a certain percentage of the fair market value that is determined by local assessors to be the total taxable value of land and additions on the property. | Land | Improvement |
|---|---|---|---|---|
| 2025 | $7,928 | $441,900 | $71,300 | $370,600 |
| 2024 | $7,131 | $386,500 | $71,300 | $315,200 |
| 2023 | $6,623 | $361,500 | $71,300 | $290,200 |
| 2022 | $6,010 | $323,800 | $71,300 | $252,500 |
| 2021 | $6,247 | $324,500 | $71,300 | $253,200 |
| 2020 | $6,272 | $318,200 | $71,300 | $246,900 |
| 2019 | $5,979 | $307,900 | $71,300 | $236,600 |
| 2018 | $5,885 | $294,100 | $66,300 | $227,800 |
| 2017 | $5,606 | $285,600 | $66,300 | $219,300 |
| 2016 | $5,388 | $287,200 | $66,300 | $220,900 |
| 2015 | $5,187 | $287,200 | $66,300 | $220,900 |
Source: Public Records
Map
Nearby Homes