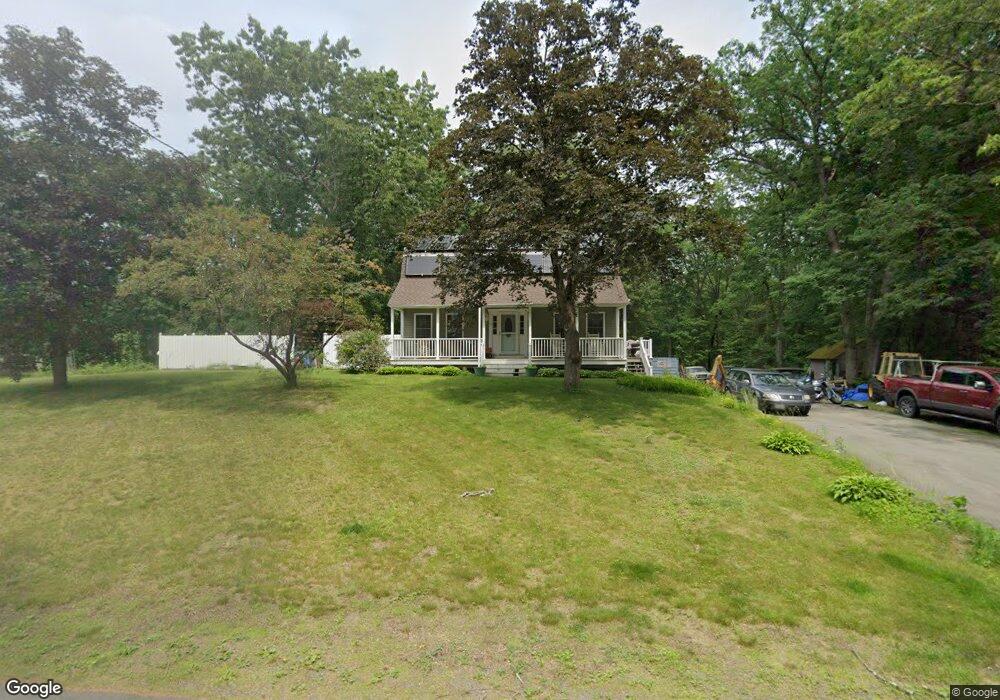
15 Laurel St Litchfield, NH 03052
Estimated Value: $592,795 - $793,000
4
Beds
3
Baths
2,646
Sq Ft
$261/Sq Ft
Est. Value
About This Home
This home is located at 15 Laurel St, Litchfield, NH 03052 and is currently estimated at $691,199, approximately $261 per square foot. 15 Laurel St is a home located in Hillsborough County with nearby schools including Griffin Memorial School and Tabernacle Christian School.
Ownership History
Date
Name
Owned For
Owner Type
Purchase Details
Closed on
Jun 14, 2019
Sold by
Hampshire Ventures Inc
Bought by
Noel Brian J and Morneau Jamie L
Current Estimated Value
Home Financials for this Owner
Home Financials are based on the most recent Mortgage that was taken out on this home.
Original Mortgage
$346,500
Outstanding Balance
$302,757
Interest Rate
4%
Mortgage Type
New Conventional
Estimated Equity
$388,442
Purchase Details
Closed on
Nov 20, 2012
Sold by
Fontaine Laura
Bought by
Fontaine Ronald
Purchase Details
Closed on
Jul 20, 2010
Sold by
Fnma
Bought by
Fontaine Ronald and Fontaine Laura
Home Financials for this Owner
Home Financials are based on the most recent Mortgage that was taken out on this home.
Original Mortgage
$204,735
Interest Rate
4.82%
Mortgage Type
Purchase Money Mortgage
Purchase Details
Closed on
Mar 4, 2010
Sold by
Sr Mark D Gilcreas and Fnma
Bought by
Federal National Mortgage Association
Create a Home Valuation Report for This Property
The Home Valuation Report is an in-depth analysis detailing your home's value as well as a comparison with similar homes in the area
Home Values in the Area
Average Home Value in this Area
Purchase History
| Date | Buyer | Sale Price | Title Company |
|---|---|---|---|
| Noel Brian J | $494,533 | -- | |
| Fontaine Ronald | -- | -- | |
| Fontaine Ronald | $176,000 | -- | |
| Federal National Mortgage Association | $301,300 | -- |
Source: Public Records
Mortgage History
| Date | Status | Borrower | Loan Amount |
|---|---|---|---|
| Open | Noel Brian J | $346,500 | |
| Closed | Noel Brian J | $74,174 | |
| Previous Owner | Federal National Mortgage Association | $204,735 | |
| Previous Owner | Federal National Mortgage Association | $285,000 |
Source: Public Records
Tax History Compared to Growth
Tax History
| Year | Tax Paid | Tax Assessment Tax Assessment Total Assessment is a certain percentage of the fair market value that is determined by local assessors to be the total taxable value of land and additions on the property. | Land | Improvement |
|---|---|---|---|---|
| 2024 | $7,693 | $370,200 | $155,000 | $215,200 |
| 2023 | $7,752 | $370,200 | $155,000 | $215,200 |
| 2022 | $8,911 | $370,200 | $155,000 | $215,200 |
| 2021 | $9,496 | $370,200 | $155,000 | $215,200 |
| 2020 | $6,878 | $370,200 | $155,000 | $215,200 |
| 2019 | $7,019 | $296,800 | $123,700 | $173,100 |
| 2017 | $6,639 | $295,200 | $123,700 | $171,500 |
| 2016 | $6,376 | $295,200 | $123,700 | $171,500 |
| 2015 | $6,016 | $295,200 | $123,700 | $171,500 |
| 2014 | $5,900 | $285,000 | $121,700 | $163,300 |
| 2013 | $5,862 | $285,000 | $121,700 | $163,300 |
Source: Public Records
Map
Nearby Homes
- 18 Tallarico St Unit Lot 23
- 5 Talent Rd Unit 29-2
- 7 Talent Rd Unit 7/29-2
- 1 Cobbler Ct
- 22 Cardinal Ln
- 36 Charles Bancroft Hwy
- 11 Rotterdam Dr
- 12 Louise Dr
- 31 Page Rd Unit 20
- 9 Tallarico St Unit Lot 4
- 11 Bradford Ln
- 30 Windsor Dr Unit 9
- 35 Windsor Dr Unit 5
- 19 Dixon Dr
- 5 Jennifer Dr Unit B
- 5 Jennifer Dr
- 5 Jennifer Dr Unit A
- 14 Turnbuckle Ln Unit 38
- 11 Merrimack Dr Unit 121
- 11 Merrimack Dr