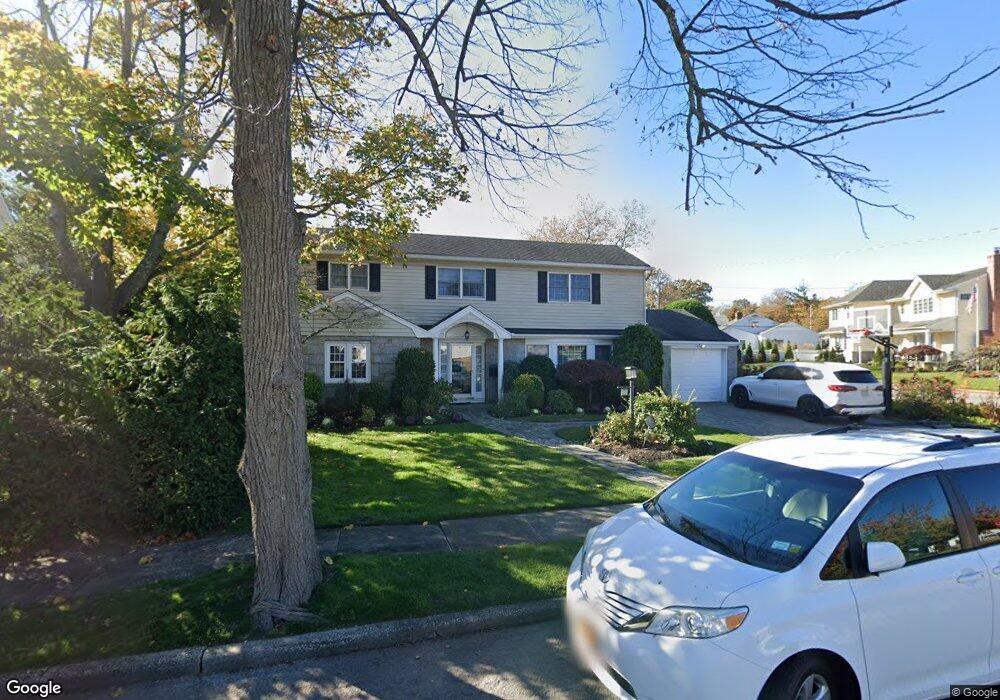
15 Leonard Dr East Rockaway, NY 11518
Estimated Value: $1,211,000 - $1,396,368
--
Bed
4
Baths
4,029
Sq Ft
$324/Sq Ft
Est. Value
About This Home
This home is located at 15 Leonard Dr, East Rockaway, NY 11518 and is currently estimated at $1,303,684, approximately $323 per square foot. 15 Leonard Dr is a home located in Nassau County with nearby schools including Lynbrook Senior High School and Reenas Bais Yaakov.
Ownership History
Date
Name
Owned For
Owner Type
Purchase Details
Closed on
Jul 15, 2010
Sold by
Bluth Mark J and Bluth Leslie
Bought by
Samelson Jordan and Samelson Tara
Current Estimated Value
Home Financials for this Owner
Home Financials are based on the most recent Mortgage that was taken out on this home.
Original Mortgage
$500,000
Outstanding Balance
$331,131
Interest Rate
4.73%
Mortgage Type
Purchase Money Mortgage
Estimated Equity
$972,553
Purchase Details
Closed on
Aug 15, 1995
Sold by
Sacks Adele
Bought by
Bluth Mark and Bluth Leslie
Home Financials for this Owner
Home Financials are based on the most recent Mortgage that was taken out on this home.
Original Mortgage
$297,000
Interest Rate
7.32%
Mortgage Type
Purchase Money Mortgage
Create a Home Valuation Report for This Property
The Home Valuation Report is an in-depth analysis detailing your home's value as well as a comparison with similar homes in the area
Home Values in the Area
Average Home Value in this Area
Purchase History
| Date | Buyer | Sale Price | Title Company |
|---|---|---|---|
| Samelson Jordan | -- | -- | |
| Samelson Jordan | -- | -- | |
| Samelson Jordan | -- | -- | |
| Samelson Jordan | -- | -- | |
| Bluth Mark | $330,000 | -- | |
| Bluth Mark | $330,000 | -- |
Source: Public Records
Mortgage History
| Date | Status | Borrower | Loan Amount |
|---|---|---|---|
| Open | Samelson Jordan | $500,000 | |
| Closed | Samelson Jordan | $500,000 | |
| Previous Owner | Bluth Mark | $297,000 |
Source: Public Records
Tax History Compared to Growth
Tax History
| Year | Tax Paid | Tax Assessment Tax Assessment Total Assessment is a certain percentage of the fair market value that is determined by local assessors to be the total taxable value of land and additions on the property. | Land | Improvement |
|---|---|---|---|---|
| 2025 | $22,190 | $890 | $354 | $536 |
| 2024 | $3,246 | $840 | $324 | $516 |
| 2023 | $21,322 | $919 | $354 | $565 |
| 2022 | $21,322 | $919 | $354 | $565 |
| 2021 | $29,623 | $959 | $345 | $614 |
| 2020 | $22,428 | $1,270 | $651 | $619 |
| 2019 | $20,834 | $1,270 | $489 | $781 |
| 2018 | $19,377 | $1,691 | $0 | $0 |
| 2017 | $18,990 | $1,691 | $651 | $1,040 |
| 2016 | $22,851 | $1,691 | $651 | $1,040 |
| 2015 | $3,788 | $1,691 | $651 | $1,040 |
| 2014 | $3,788 | $1,691 | $651 | $1,040 |
| 2013 | $3,525 | $1,691 | $651 | $1,040 |
Source: Public Records
Map
Nearby Homes