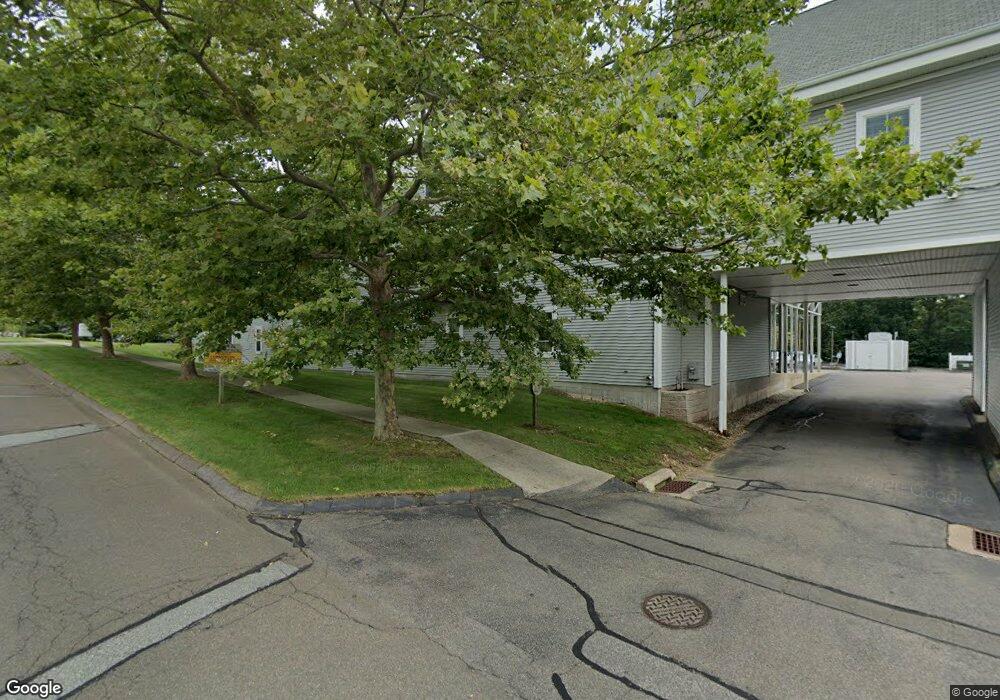
15 Liberty Way Niantic, CT 06357
Estimated Value: $2,023,165
--
Bed
2
Baths
23,811
Sq Ft
$85/Sq Ft
Est. Value
About This Home
This home is located at 15 Liberty Way, Niantic, CT 06357 and is currently estimated at $2,023,165, approximately $84 per square foot. 15 Liberty Way is a home located in New London County with nearby schools including East Lyme Middle School, East Lyme High School, and Carelot Children's Center - East Lyme.
Ownership History
Date
Name
Owned For
Owner Type
Purchase Details
Closed on
Jul 28, 2022
Sold by
Fifteen Liberty Way Llc
Bought by
Lighthouse Voc Ed Ctr
Current Estimated Value
Home Financials for this Owner
Home Financials are based on the most recent Mortgage that was taken out on this home.
Original Mortgage
$1,280,000
Outstanding Balance
$1,226,322
Interest Rate
5.78%
Mortgage Type
Purchase Money Mortgage
Estimated Equity
$796,843
Purchase Details
Closed on
Jun 15, 2007
Sold by
Sea Spray Homes Llc
Bought by
Miller Lee
Home Financials for this Owner
Home Financials are based on the most recent Mortgage that was taken out on this home.
Original Mortgage
$150,000
Interest Rate
6.19%
Mortgage Type
Purchase Money Mortgage
Purchase Details
Closed on
Jan 2, 1997
Sold by
R I Waterman Prop
Bought by
Fifteen Liberty Way
Purchase Details
Closed on
Jul 18, 1995
Sold by
Conn Galaxy Prop Inc
Bought by
Rhode Island Waterman
Create a Home Valuation Report for This Property
The Home Valuation Report is an in-depth analysis detailing your home's value as well as a comparison with similar homes in the area
Home Values in the Area
Average Home Value in this Area
Purchase History
| Date | Buyer | Sale Price | Title Company |
|---|---|---|---|
| Lighthouse Voc Ed Ctr | $1,600,000 | None Available | |
| Lighthouse Voc Ed Ctr | $1,600,000 | None Available | |
| Miller Lee | $290,741 | -- | |
| Miller Lee | $290,741 | -- | |
| Fifteen Liberty Way | $425,000 | -- | |
| Rhode Island Waterman | $780,000 | -- |
Source: Public Records
Mortgage History
| Date | Status | Borrower | Loan Amount |
|---|---|---|---|
| Open | Lighthouse Voc Ed Ctr | $1,280,000 | |
| Closed | Lighthouse Voc Ed Ctr | $1,280,000 | |
| Previous Owner | Rhode Island Waterman | $150,000 |
Source: Public Records
Tax History Compared to Growth
Tax History
| Year | Tax Paid | Tax Assessment Tax Assessment Total Assessment is a certain percentage of the fair market value that is determined by local assessors to be the total taxable value of land and additions on the property. | Land | Improvement |
|---|---|---|---|---|
| 2025 | $0 | $1,222,060 | $279,650 | $942,410 |
| 2024 | $31,971 | $1,222,060 | $279,650 | $942,410 |
| 2023 | $31,971 | $1,284,990 | $334,810 | $950,180 |
| 2022 | $30,634 | $1,284,990 | $334,810 | $950,180 |
| 2021 | $38,707 | $1,357,650 | $327,390 | $1,030,260 |
| 2020 | $39,867 | $1,405,740 | $327,390 | $1,078,350 |
| 2019 | $39,628 | $1,405,740 | $327,390 | $1,078,350 |
| 2018 | $38,447 | $1,405,740 | $327,390 | $1,078,350 |
| 2017 | $36,774 | $1,405,740 | $327,390 | $1,078,350 |
| 2016 | $34,723 | $1,369,200 | $239,470 | $1,129,730 |
| 2015 | $33,833 | $1,369,200 | $239,470 | $1,129,730 |
| 2014 | $32,902 | $1,369,200 | $239,470 | $1,129,730 |
Source: Public Records
Map
Nearby Homes
- 15 Freedom Way Unit 92
- 14 Colton Rd
- 4 Jean Dr
- 40 Spinnaker Dr
- 188 4 Mile River Rd
- 55 Corey Ln
- 18 Twin Valley Rd
- 3 Twin Valley Rd
- 16 Twin Valley Rd
- 76 S Edgewood Rd
- Waramaug Plan at Riverside Reserve
- Highland Plan at Riverside Reserve
- Hayward Plan at Riverside Reserve
- Ashford Plan at Riverside Reserve
- Lillinonah Plan at Riverside Reserve
- 78 Corey Ln Unit 9
- 2 Riverdale Landing
- 22 Riverdale Landing
- 23 Over Brook Rd
- 57 Spring Rock Rd