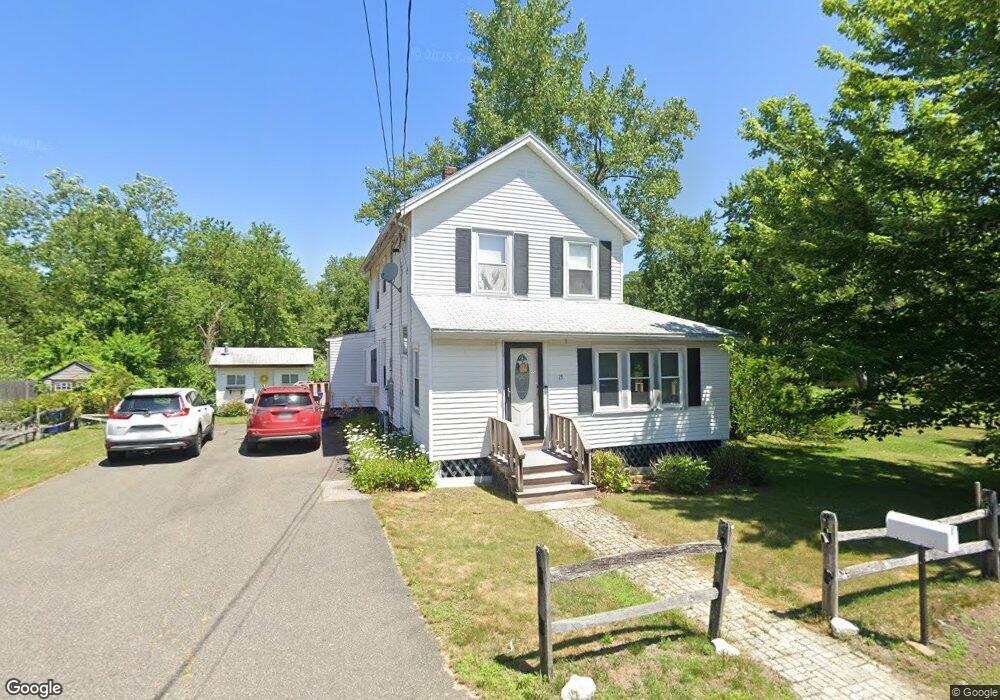
15 Lilypond Ave Saugus, MA 01906
Lynnhurst NeighborhoodEstimated Value: $520,166 - $560,000
2
Beds
1
Bath
1,080
Sq Ft
$506/Sq Ft
Est. Value
About This Home
This home is located at 15 Lilypond Ave, Saugus, MA 01906 and is currently estimated at $546,792, approximately $506 per square foot. 15 Lilypond Ave is a home located in Essex County with nearby schools including Saugus High School and Pioneer Charter School Of Science II.
Ownership History
Date
Name
Owned For
Owner Type
Purchase Details
Closed on
Apr 12, 2023
Sold by
Vater Susan Jean Est
Bought by
Johnson Samuel
Current Estimated Value
Home Financials for this Owner
Home Financials are based on the most recent Mortgage that was taken out on this home.
Original Mortgage
$436,500
Outstanding Balance
$424,479
Interest Rate
6.65%
Mortgage Type
Purchase Money Mortgage
Estimated Equity
$122,313
Purchase Details
Closed on
Jan 19, 1990
Sold by
Willis James
Bought by
Willis Susan
Home Financials for this Owner
Home Financials are based on the most recent Mortgage that was taken out on this home.
Original Mortgage
$10,000
Interest Rate
9.68%
Mortgage Type
Purchase Money Mortgage
Create a Home Valuation Report for This Property
The Home Valuation Report is an in-depth analysis detailing your home's value as well as a comparison with similar homes in the area
Home Values in the Area
Average Home Value in this Area
Purchase History
| Date | Buyer | Sale Price | Title Company |
|---|---|---|---|
| Johnson Samuel | $485,000 | None Available | |
| Willis Susan | $10,000 | -- | |
| Willis Susan | $10,000 | -- |
Source: Public Records
Mortgage History
| Date | Status | Borrower | Loan Amount |
|---|---|---|---|
| Open | Johnson Samuel | $436,500 | |
| Previous Owner | Willis Susan | $45,000 | |
| Previous Owner | Willis Susan | $64,000 | |
| Previous Owner | Willis Susan | $10,000 |
Source: Public Records
Tax History
| Year | Tax Paid | Tax Assessment Tax Assessment Total Assessment is a certain percentage of the fair market value that is determined by local assessors to be the total taxable value of land and additions on the property. | Land | Improvement |
|---|---|---|---|---|
| 2025 | $3,940 | $368,900 | $188,900 | $180,000 |
| 2024 | $3,785 | $355,400 | $178,100 | $177,300 |
| 2023 | $3,719 | $330,300 | $156,500 | $173,800 |
| 2022 | $3,419 | $284,700 | $143,500 | $141,200 |
| 2021 | $3,158 | $255,900 | $124,700 | $131,200 |
| 2020 | $2,979 | $249,900 | $118,700 | $131,200 |
| 2019 | $2,912 | $239,100 | $107,900 | $131,200 |
| 2018 | $2,651 | $228,900 | $104,700 | $124,200 |
| 2017 | $2,469 | $204,900 | $97,700 | $107,200 |
| 2016 | $2,255 | $184,800 | $97,500 | $87,300 |
| 2015 | $2,117 | $176,100 | $92,900 | $83,200 |
| 2014 | $2,815 | $242,500 | $154,800 | $87,700 |
Source: Public Records
Map
Nearby Homes
- 24 Palmetto St
- 7 Nirvana Dr
- 29 Susan Dr
- 7 Central St
- 52 Hesper St
- 227 Walnut St
- 846 Broadway Unit 40
- 62 Main St
- 36 Jasper St
- 4 Oneil Way
- 25 Auburn St
- 148 Forest St
- 801 Sherwood Forest Ln
- 348 Lynn Fells Pkwy
- 905 Sherwood Forest Ln
- 921 Sherwood Forest Ln
- 23 Orchard Ave
- 57 Vine St
- 7 Adams Ave
- 187 Hamilton St
Your Personal Tour Guide
Ask me questions while you tour the home.