Estimated Value: $322,742 - $480,000
3
Beds
1
Bath
960
Sq Ft
$421/Sq Ft
Est. Value
About This Home
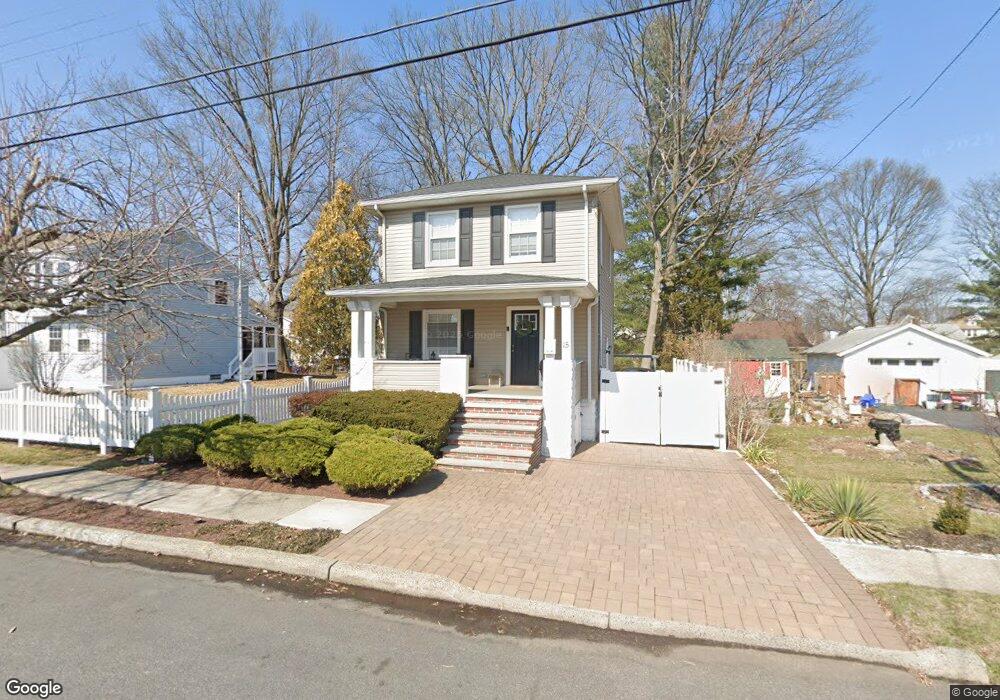
This home is located at 15 Linden St, Fords, NJ 08863 and is currently estimated at $403,936, approximately $420 per square foot. 15 Linden St is a home located in Middlesex County with nearby schools including Ford Avenue Elementary School, Fords Middle School, and Woodbridge High School.
Ownership History
Date
Name
Owned For
Owner Type
Purchase Details
Closed on
Sep 7, 2023
Sold by
Furtak Jacek
Bought by
Furtak Jacek and Furtak Agnieszka
Current Estimated Value
Purchase Details
Closed on
Sep 26, 2013
Sold by
51 Holly Road Associates Llc
Bought by
Furtak Jacek
Home Financials for this Owner
Home Financials are based on the most recent Mortgage that was taken out on this home.
Original Mortgage
$211,410
Interest Rate
4.61%
Mortgage Type
New Conventional
Purchase Details
Closed on
Jul 12, 2013
Sold by
Elmore Raymond V
Bought by
51 Holly Road Associates Llc
Create a Home Valuation Report for This Property
The Home Valuation Report is an in-depth analysis detailing your home's value as well as a comparison with similar homes in the area
Home Values in the Area
Average Home Value in this Area
Purchase History
| Date | Buyer | Sale Price | Title Company |
|---|---|---|---|
| Furtak Jacek | -- | None Listed On Document | |
| Furtak Jacek | -- | None Listed On Document | |
| Furtak Jacek | $234,900 | Agent For Old Republic Nati | |
| 51 Holly Road Associates Llc | $82,500 | None Available |
Source: Public Records
Mortgage History
| Date | Status | Borrower | Loan Amount |
|---|---|---|---|
| Previous Owner | Furtak Jacek | $211,410 |
Source: Public Records
Tax History Compared to Growth
Tax History
| Year | Tax Paid | Tax Assessment Tax Assessment Total Assessment is a certain percentage of the fair market value that is determined by local assessors to be the total taxable value of land and additions on the property. | Land | Improvement |
|---|---|---|---|---|
| 2025 | $7,172 | $56,800 | $16,700 | $40,100 |
| 2024 | $6,963 | $56,800 | $16,700 | $40,100 |
| 2023 | $6,963 | $56,800 | $16,700 | $40,100 |
| 2022 | $6,776 | $56,800 | $16,700 | $40,100 |
| 2021 | $6,706 | $56,800 | $16,700 | $40,100 |
| 2020 | $6,488 | $56,800 | $16,700 | $40,100 |
| 2019 | $6,321 | $56,800 | $16,700 | $40,100 |
| 2018 | $6,196 | $56,800 | $16,700 | $40,100 |
| 2017 | $6,087 | $56,800 | $16,700 | $40,100 |
| 2016 | $6,037 | $56,800 | $16,700 | $40,100 |
| 2015 | $5,919 | $56,800 | $16,700 | $40,100 |
| 2014 | $5,790 | $41,500 | $16,700 | $24,800 |
Source: Public Records
Map
Nearby Homes