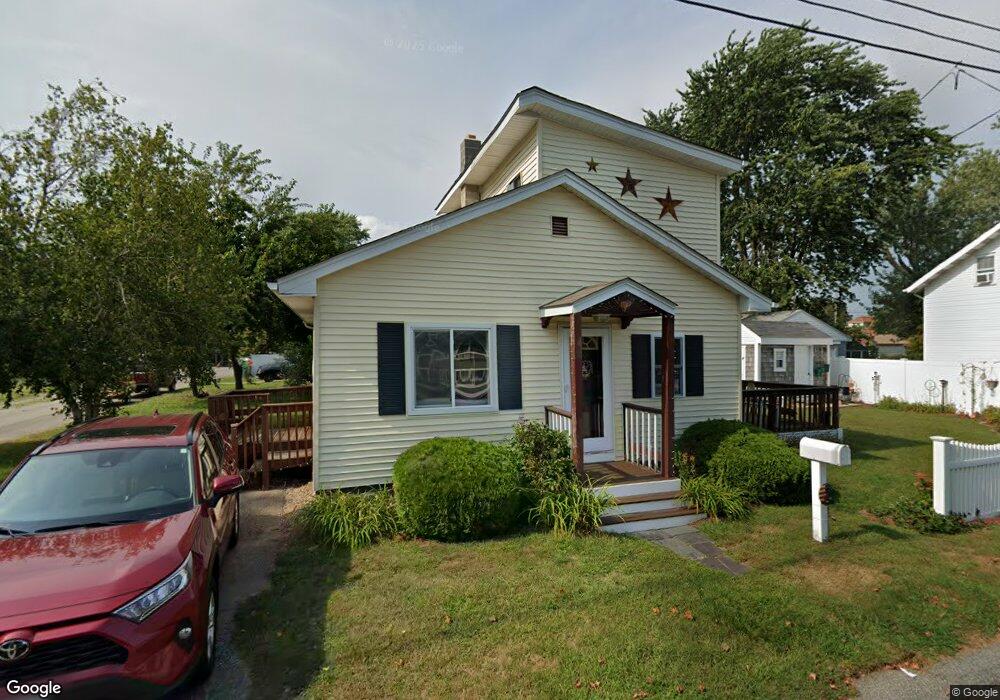
15 Loring Rd Warwick, RI 02889
Conimicut-Shawomet NeighborhoodEstimated Value: $291,000 - $341,000
2
Beds
1
Bath
1,068
Sq Ft
$301/Sq Ft
Est. Value
About This Home
This home is located at 15 Loring Rd, Warwick, RI 02889 and is currently estimated at $321,790, approximately $301 per square foot. 15 Loring Rd is a home located in Kent County with nearby schools including Saint Kevin School and Bishop Hendricken High School.
Ownership History
Date
Name
Owned For
Owner Type
Purchase Details
Closed on
Jan 27, 2006
Sold by
Menard Anthony V
Bought by
Grimaldi Joseph F
Current Estimated Value
Purchase Details
Closed on
Apr 15, 2004
Sold by
Shakir John
Bought by
Menard Anthony V
Purchase Details
Closed on
May 9, 2003
Sold by
Becker William and Becker Janine S
Bought by
Shakir Joan
Purchase Details
Closed on
Feb 1, 2000
Sold by
Ge Capitals Mtg Serv
Bought by
Becker William and Becker Janine S
Create a Home Valuation Report for This Property
The Home Valuation Report is an in-depth analysis detailing your home's value as well as a comparison with similar homes in the area
Home Values in the Area
Average Home Value in this Area
Purchase History
| Date | Buyer | Sale Price | Title Company |
|---|---|---|---|
| Grimaldi Joseph F | $162,500 | -- | |
| Menard Anthony V | $110,000 | -- | |
| Shakir Joan | $92,500 | -- | |
| Becker William | $30,000 | -- |
Source: Public Records
Mortgage History
| Date | Status | Borrower | Loan Amount |
|---|---|---|---|
| Open | Becker William | $185,300 | |
| Closed | Becker William | $12,500 |
Source: Public Records
Tax History
| Year | Tax Paid | Tax Assessment Tax Assessment Total Assessment is a certain percentage of the fair market value that is determined by local assessors to be the total taxable value of land and additions on the property. | Land | Improvement |
|---|---|---|---|---|
| 2025 | $3,301 | $259,900 | $92,200 | $167,700 |
| 2024 | $2,882 | $199,200 | $71,400 | $127,800 |
| 2023 | $2,827 | $199,200 | $71,400 | $127,800 |
| 2022 | $2,652 | $141,600 | $43,200 | $98,400 |
| 2021 | $2,652 | $141,600 | $43,200 | $98,400 |
| 2020 | $2,652 | $141,600 | $43,200 | $98,400 |
| 2019 | $2,652 | $141,600 | $43,200 | $98,400 |
| 2018 | $2,026 | $97,400 | $40,500 | $56,900 |
| 2017 | $1,971 | $97,400 | $40,500 | $56,900 |
| 2016 | $1,971 | $97,400 | $40,500 | $56,900 |
| 2015 | $2,193 | $105,700 | $47,200 | $58,500 |
| 2014 | $2,120 | $105,700 | $47,200 | $58,500 |
| 2013 | $2,092 | $105,700 | $47,200 | $58,500 |
Source: Public Records
Map
Nearby Homes
Your Personal Tour Guide
Ask me questions while you tour the home.