Estimated Value: $339,000 - $454,000
4
Beds
3
Baths
2,128
Sq Ft
$180/Sq Ft
Est. Value
About This Home
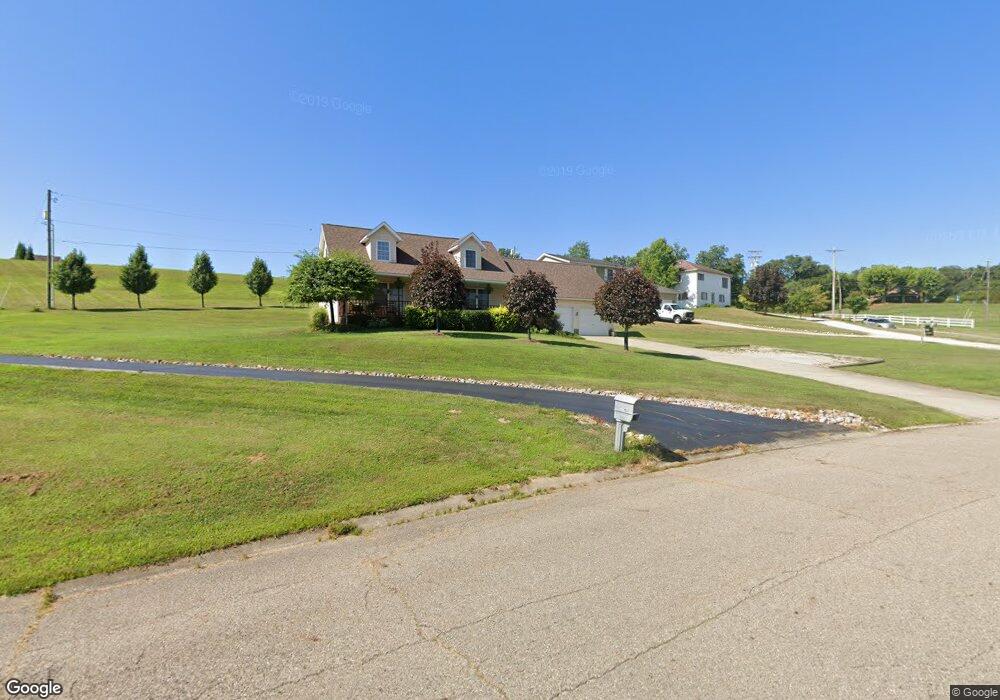
This home is located at 15 Mae St, Logan, OH 43138 and is currently estimated at $384,081, approximately $180 per square foot. 15 Mae St is a home located in Hocking County with nearby schools including Central Elementary School.
Ownership History
Date
Name
Owned For
Owner Type
Purchase Details
Closed on
Apr 15, 2005
Sold by
Sirva Relocation Llc
Bought by
Enderle Russell E and Enderle Donna G
Current Estimated Value
Home Financials for this Owner
Home Financials are based on the most recent Mortgage that was taken out on this home.
Original Mortgage
$127,120
Outstanding Balance
$66,745
Interest Rate
6.05%
Mortgage Type
New Conventional
Estimated Equity
$317,336
Purchase Details
Closed on
Dec 8, 2004
Sold by
Debord Stephen Michael and Debord Susan Renee
Bought by
Sirva Relocation Llc
Home Financials for this Owner
Home Financials are based on the most recent Mortgage that was taken out on this home.
Original Mortgage
$23,835
Interest Rate
6.05%
Mortgage Type
Stand Alone Second
Create a Home Valuation Report for This Property
The Home Valuation Report is an in-depth analysis detailing your home's value as well as a comparison with similar homes in the area
Home Values in the Area
Average Home Value in this Area
Purchase History
| Date | Buyer | Sale Price | Title Company |
|---|---|---|---|
| Enderle Russell E | $21,000 | None Available | |
| Sirva Relocation Llc | -- | None Available |
Source: Public Records
Mortgage History
| Date | Status | Borrower | Loan Amount |
|---|---|---|---|
| Open | Enderle Russell E | $127,120 | |
| Previous Owner | Sirva Relocation Llc | $23,835 |
Source: Public Records
Tax History Compared to Growth
Tax History
| Year | Tax Paid | Tax Assessment Tax Assessment Total Assessment is a certain percentage of the fair market value that is determined by local assessors to be the total taxable value of land and additions on the property. | Land | Improvement |
|---|---|---|---|---|
| 2024 | $3,374 | $85,790 | $19,250 | $66,540 |
| 2023 | $3,374 | $85,790 | $19,250 | $66,540 |
| 2022 | $3,379 | $85,790 | $19,250 | $66,540 |
| 2021 | $2,648 | $62,290 | $15,230 | $47,060 |
| 2020 | $2,650 | $62,290 | $15,230 | $47,060 |
| 2019 | $2,650 | $62,290 | $15,230 | $47,060 |
| 2018 | $2,513 | $60,120 | $13,060 | $47,060 |
| 2017 | $2,366 | $60,120 | $13,060 | $47,060 |
| 2016 | $2,350 | $60,120 | $13,060 | $47,060 |
| 2015 | $2,465 | $59,080 | $13,800 | $45,280 |
| 2014 | $2,465 | $59,080 | $13,800 | $45,280 |
| 2013 | $2,475 | $59,080 | $13,800 | $45,280 |
Source: Public Records
Map
Nearby Homes
- 953 Marla Ave
- 849 Mohican Ave
- 875 Walhonding Ave
- 787 Huntley Ave
- 743 Summit Dr
- 741 Huntley Ave
- 111 Falls St
- 32366 Lilac Ln
- 28583 Hawthorne Way
- 32268 Cedar Ln
- 0 Redbud Ln Unit LOT 62 224020754
- 67 W Front St
- State Route 328
- 90 S Culver St
- 571 E Main St
- 586 E Main St
- 385 W Main St
- 597 Henrietta Ave
- 171 Warner Ave
- 331 Short St
- 3 Mae St
- 65 Mae St
- 0 Nickle Plate Rd Unit Lot 2 2517948
- 0 Nickle Plate Rd Unit Lot 3 2811538
- 0 Nickle Plate Rd Unit Lot 6 2811545
- 0 Nickle Plate Rd Unit Lot 7
- 13878 Nickel Plate Rd
- 13846 Nickel Plate Rd
- 85 Mae St
- 13896 Nickel Plate Rd
- 74 Mae St
- 13839 Nickel Plate Rd
- 13810 Nickel Plate Rd
- 6085 Township Rd
- 0 Walnut St Unit Lot 40 210014503
- 3 Linden Ln
- 0 Maxville Rd E Unit 222033655
- 13789 Nickel Plate Rd
- 99 Mae St
- 25 Mae St